Purpose
To determine if hyperreflective foci in the outer retina are associated with photoreceptor integrity and the logarithm of minimal angle of resolution (logMAR) visual acuity (VA) in patients with diabetic macular edema (DME).
Design
Retrospective, observational, cross-sectional study.
Methods
Patients (n = 76; 108 eyes) with clinically relevant macular edema and no serous retinal detachment were analyzed retrospectively. Spectral-domain optical coherence tomography (SD-OCT) images were obtained for all patients. We investigated the relationship between the hyperreflective foci in the outer retinal layers of the external limiting membrane (ELM) at the fovea and the photoreceptor integrity and VA.
Results
SD-OCT showed that 58 eyes (53.7%) had hyperreflective foci in the outer retinal layers, and 107 eyes (99.1%) had hyperreflective foci in the inner retinal layers. The logMAR VA was significantly ( P < .0001) worse in eyes with hyperreflective foci in the outer retinal layers than in eyes without them (0.463 ± 0.382 vs 0.127 ± 0.206, respectively). Disruption of the ELM line on OCT was significantly ( P < .0001, for both comparisons) associated with both hyperreflective foci in the outer retinal layers and poor logMAR VA. Disruption of the junction of the inner and outer segment line (IS/OS) also was related to hyperreflective foci in the outer retinal layers and poor logMAR VA ( P < .0001 for both comparisons).
Conclusions
The presence of hyperreflective foci in the outer retina is closely associated with a disrupted ELM and IS/OS line on SD-OCT images and decreased VA in DME.
Diabetic macular edema (DME) is a leading cause of visual impairment in patients with diabetes. The Wisconsin Epidemiologic Study of Diabetic Retinopathy reported that the incidence of DME over a 10-year period was 20.1% in a younger-onset group, 25.4% in an older-onset group taking insulin, and 13.9% in an older-onset group not taking insulin. Since the number of patients with diabetic retinopathy (DR) and vision-threatening DR is expected to increase, further research is needed into development of treatments and evaluation techniques for DME.
Optical coherence tomography (OCT) has been used widely to assess the pathologic structures in the macula and objectively measure the retinal thickness. To date, a modest correlation between OCT-measured central retinal thickness and visual acuity (VA) has been reported to some extent in DME. Despite the clinical relevance of this finding, clinicians frequently have observed eyes with poor visual outcomes regardless of complete resolution of the macular edema, and the VA is highly variable in association with a given degree of retinal edema. These clinical findings suggested that a pathogenesis other than macular thickening may be at play and should be investigated.
In addition to quantification, later generations of OCT also enable clinicians to appreciate the individual retinal layers qualitatively. In particular, spectral-domain (SD)-OCT clearly delineates the external limiting membrane (ELM), which corresponds to the adherens junctions between the Müller cells and photoreceptor cells and also prevents passage of macromolecules. The junction between the inner and outer segments of the photoreceptors (IS/OS) on OCT images might represent the photoreceptor function, which is light perception. These layers on the OCT images reportedly provide important information about pathologies of the photoreceptors. Several studies have reported a correlation between damage to the foveal photoreceptors and the VA in retinal vascular diseases. Collectively, those studies have suggested both the clinical relevance of the photoreceptor damage and a novel pathogenesis in DME that involves photoreceptor dysfunction and macular thickening.
Recently, Bolz and associates used SD-OCT to show that hyperreflective foci are associated with DME and that these structures are scattered throughout all retinal layers. The authors postulated that these foci might represent the initial stages in the development of intraretinal hard exudates and that the foci might be subclinical features of lipoprotein extravasation after breakdown of the inner blood-retina barrier. Considering this, Ota and associates, who have studied hyperreflective dots in serous retinal detachments (SRDs), speculated that fluid and exudates, such as lipids and proteins, that flow into the subretinal space through the outer retinal cleavage may be deposited as subfoveal hard exudates.
In the current study, we characterized the sparse hyperreflective foci, subclinical findings that are invisible during clinical ophthalmoscopic examinations, and investigated their association with the photoreceptor status and visual function in DME without SRDs.
Patients and Methods
We retrospectively examined 108 eyes of 76 patients (mean age ± standard deviation, 65.0 ± 9.1 years; range, 35-82 years; 5 patients with type 1 diabetes mellitus [DM] and 71 with type 2 DM) who had visual disturbances attributable to clinically relevant macular edema and were treated at Kyoto University Hospital between December 12, 2007 and March 30, 2010. All patients had undergone comprehensive ophthalmologic examinations, including measurement of the best-corrected visual acuity (BCVA), slit-lamp biomicroscopy, color fundus photography, and SD-OCT. We excluded eyes with SRD, hard exudates at the fovea, other retinal diseases (including uveitis, vitreomacular traction syndrome, or macular pucker), or significant media opacities, such as cataract or vitreous hemorrhage.
Optical Coherence Tomography
The morphologic features of DME, including the ELM, IS/OS, and hyperreflective foci, were assessed with SD-OCT (Spectralis; Heidelberg Engineering, Heidelberg, Germany). Twenty-degree radial scans centered on the fovea were obtained in a clockwise manner in all eyes, and 49 raster scans were used to evaluate the mean retinal thickness (from the innermost internal limiting membrane [ILM] to the retinal pigment epithelium [RPE]) at the fovea (radius, 500 μm). The central fovea was defined as the location without the inner retinal layers in the macular region. Subsequently, the morphologic features within a scanned 1-mm area centered on the fovea were evaluated for each eye. The status of the ELM and IS/OS was classified according to previously described methods with some modifications. Briefly, eyes with an ELM line that appeared to be complete at the fovea in all scans were classified as ELM (+); eyes with an interrupted ELM line in 1 scan or more were classified as ELM (±); and eyes with an undetectable ELM line in the fovea were classified as ELM (−). Each eye also was classified based on the status of the IS/OS line beneath the fovea using the same criteria described for the ELM line, that is, IS/OS (+), IS/OS (±), and IS/OS (−).
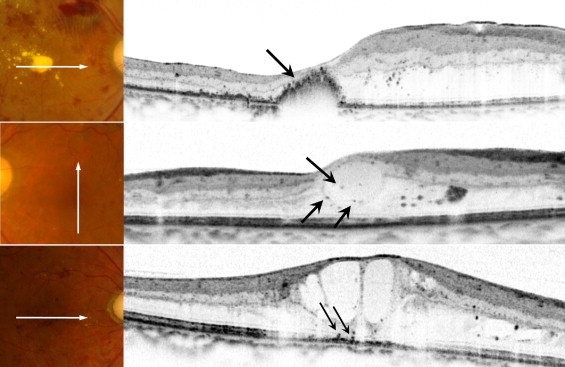
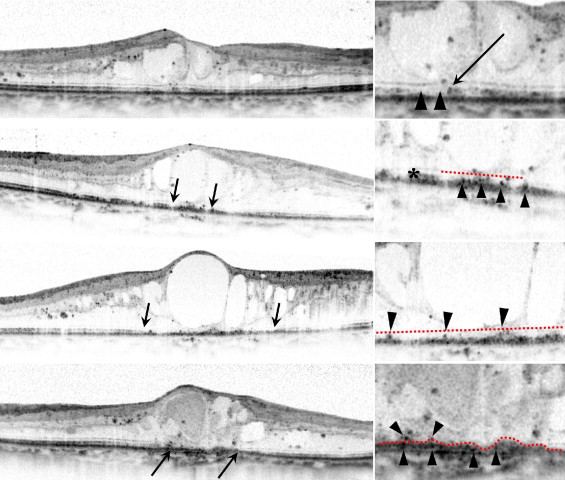
Since a number of studies have reported the photoreceptor status as a novel parameter in macular edema associated with retinal vascular diseases, we evaluated the presence of the hyperreflective foci in the outer retinal layers. It was previously reported that ELM acts as a barrier against macromolecules, which led us to hypothesize that an intact ELM might block diffusion of proteins or lipids from the damaged retinal vasculature, whereas they might otherwise migrate freely within the inner retinal layers. In other words, migration of hyperreflective foci into the outer retinal layers of the ELM might indicate that the barrier properties of the ELM are disrupted or that the inner or outer segments necessary for light perception have been damaged. Thus, we evaluated and defined the hyperreflective foci in the outer retinal layers from the ELM to the RPE within each 1-mm scanned area centered on the fovea ( Figure 1 ) . As discussed previously, the ELM was often interrupted or absent at the fovea. When 2 or more fragments of the ELM line were detected in the scanned area, we drew imaginary lines between the ends of the ELM lines ( Figure 2 ) . When the ELM line reached the outer side without interruption and ended at the RPE-choriocapillaris complex, we considered the area where the ELM line was absent as being above the ELM line and did not draw an additional line ( Figure 2 , Bottom row). The sparse hyperreflective foci were round or oval as reported previously, and the hyperreflective foci aggregates were often seen on the OCT images and corresponded to hard exudates in the fundus photographs. We excluded eyes with aggregates within the 1-mm central scanned area ( Figure 1 ), because the aim of this study was to evaluate the association between the photoreceptor status and sparse hyperreflective foci, which are considered as subclinical hard exudates.
Two experienced masked examiners (Y.M., N.A.) classified the status of the ELM and the IS/OS and the presence of the hyperreflective foci, and a third higher-level grader (T.H.) classified any images about which there was disagreement. The kappa coefficient was computed as a measure of reliability between the observers.
Statistical Analysis
All values are expressed as the mean ± standard deviation. All BCVA measurements were converted to the logarithm of the minimal angle of resolution (logMAR) equivalents before statistical analysis. Student t tests and χ 2 tests were used to compare the 2 hyperreflective foci groups (foci absent in the outer retinal layers group vs foci present in the outer retinal layers group) regarding sex, age, duration of diabetes, HbA1C, total cholesterol, the presence of hypertension, logMAR VA, type of DR, the hyperreflective foci in the inner retinal layers of ELM line ( Figure 1 ), and the integrity of the IS/OS and the ELM lines. The χ 2 test also was used to analyze the relationship between the integrity of the ELM line and the IS/OS line. Comparisons of the logMAR VA levels of the 3 groups that were classified based on the status of the IS/OS or ELM lines and comparison of the foveal thickness of the 3 ELM groups were carried out using 1-way analysis of variance, with post hoc comparisons tested by Scheffe procedure. The relationship between the logMAR VA and the foveal thickness was analyzed using the Pearson correlation coefficient. A P value < .05 was considered statistically significant. All analyses, except for the kappa coefficient, were performed using StatView version 5.0 (SAS Institute, Cary, North Carolina, USA). Calculation of the kappa coefficient was performed using SPSS version 17 (GraphPad Software, La Jolla, California, USA).
Results
Assessment of Inter-observer Agreement
The kappa coefficient was 0.897 ( P < .001) for the ELM, 0.833 ( P < .001) for the IS/OS, and 0.926 ( P < .001) for location of the hyperreflective foci. These results indicated good inter-observer agreement.
Hyperreflective Foci in the Outer Retinal Layers of the External Limiting Membrane
Recent publications have documented the presence of hyperreflective foci in Spectralis OCT images of DR, but it is unclear whether the finding is related to visual function, which encouraged us to investigate the clinical relevance of hyperreflective foci in DME. We observed hyperreflective foci in the central 1-mm area of the fovea in the inner retinal layers in 107 of the 108 eyes (99.1%) with DME ( Figure 1 ). However, only 58 of the 108 eyes (53.7%) had hyperreflective foci in the outer retinal layers.
The logMAR VA was significantly ( P < .0001) worse in the group with hyperreflective foci in the outer retinal layers compared with the group without hyperreflective foci in the outer retinal layers ( Table 1 ), although no other systemic or ocular parameters differed between the groups. We further investigated how hyperreflective foci in the outer retinal layers contributed to the pathogenesis of DME and found that 45 of 50 eyes (90%) without hyperreflective foci in the outer retinal layers had an intact ELM, whereas 45 of 58 eyes (77.6%) with hyperreflective foci in the outer retinal layers had a disrupted ELM ( P < .0001) ( Table 2 ). The logMAR VA in the ELM (+) group also was significantly better than that in either the ELM (±) or ELM (-) group ( P < .0001 for both comparisons). These results suggested that the pathologic association between the hyperreflective foci in the outer retinal layers and disrupted ELM may contribute to visual dysfunction in DME.
| Characteristic | Eyes With Hyperreflective Foci in Outer Retinal Layers | Eyes Without Hyperreflective Foci in Outer Retinal Layers | P Value |
|---|---|---|---|
| No. eyes/patients | 58/35 | 50/41 | — |
| Men/women | 28/30 | 27/23 | .5530 |
| Age (years) | 65.7 ± 8.2 | 64.3 ± 10.1 | .1330 |
| Diabetes duration (years) | 16.9 ± 8.8 | 17.6 ± 9.7 | .0686 |
| HbA1C (%) | 7.22 ± 1.39 | 7.26 ± 1.09 | .8892 |
| Total cholesterol (mg/dL) | 213 ± 44 | 198 ± 35 | .1377 |
| Hypertension, no. (%) | 28 (48.3) | 24 (48.0) | .9772 |
| Visual acuity (logMAR) | 0.463 ± 0.382 | 0.127 ± 0.206 | <.0001 |
| DR type, no. (%) | |||
| Mild NPDR | 0 (0.0) | 1 (2.0) | — |
| Moderate NPDR | 19 (32.8) | 18 (36.0) | — |
| Severe NPDR | 20 (34.5) | 18 (36.0) | — |
| PDR | 19 (32.8) | 13 (26.0) | .6428 |
| No. eyes with hyperreflective foci in inner retinal layers (%) | 58 (100.0) | 49 (98.0) | .2792 |
| ELM (+) | ELM (±) | ELM (−) | P Value | |
|---|---|---|---|---|
| Hyperreflective foci in outer retinal layers | ||||
| Absent (no. eyes) | 45 | 5 | 0 | — |
| Present (no. eyes) | 13 | 39 | 6 | <.0001 |
| Visual acuity (logMAR) | 0.153 ± 0.207 | 0.416 ± 0.370 | 1.008 ± 0.229 | <.0001 |
Stay updated, free articles. Join our Telegram channel

Full access? Get Clinical Tree


