Purpose
To investigate the relationship between choroidal thickness and angiographic abnormalities in central serous chorioretinopathy (CSC) eyes by swept-source optical coherence tomography (swept-OCT), before and after half-fluence photodynamic therapy (PDT).
Design
Prospective interventional case series.
Methods
Consecutive patients presenting with treatment-naive active CSC underwent a complete ophthalmologic examination, including swept-OCT at study entry and at 7 days and 30 days after treatment with half-fluence PDT. The main outcome measures were changes in choroidal maps after PDT (mean ± SD) and the relationship between choroidal thickness and angiographic abnormalities.
Results
Of 12 patients (2 females, 10 males; mean age, 55.6 ± 14.0 years), 12 eyes were included. At study entry, mean choroidal thickness measured in the center of the fovea was significantly thicker in the study eyes as compared to the fellow eyes (420.7 ± 107.5 μm vs 349.2 ± 109.7 μm, respectively; P = 0.016). Mean choroidal thickness in the center of the fovea significantly decreased in the study eyes at both 7 days (380.2 ± 113 μm; P = 0.005) and 30 days after PDT (362.3 ± 111 μm; P = 0.002). A similar significant choroidal thinning was recorded in each early treatment of diabetic retinopathy study (ETDRS) applied to 3D swept-OCT maps. At each time point, mean choroidal thickness was significantly thicker in sectors with than in sectors without angiographic abnormalities (421 ± 102.4 μm vs 397.6 ± 96.5 μm, P = 0.002 at study entry; 381.2 ± 106.6 μm vs 364 ± 101.2 μm, P = 0.01 at day 7; 366.3 ± 103.2 μm vs 347.2 ± 99.6 μm at day 30).
Conclusions
Using swept-OCT, we demonstrated that in active CSC, choroidal thickness is increased to a greater extent in areas characterized by angiographic abnormalities. This increased choroidal thickness may persist even after PDT.
Central serous chorioretinopathy (CSC) is a relatively common retinal disorder that often occurs in patients in the professionally active age range. In CSC, accumulation of fluid under the retina appears to be caused by a dysfunction of the retinal pigment epithelium (RPE) as a result of hyperpermeability and swelling of the choroid. A prolonged retinal detachment in the macula of patients with CSC leads to permanent central vision loss due to photoreceptor atrophy. Therefore, several treatment options have emerged in the attempt to accelerate the resolution of subretinal fluid accumulation and to improve the visual outcomes in patients with chronic CSC. However, to date there is no international consensus concerning the optimal treatment protocol of CSC.
Focal laser photocoagulation, the classic treatment for CSC patients, could shorten the symptom duration of ∼2 months. However, a prospective, randomized clinical trial found that the final recurrence rate in the laser photocoagulation group was unchanged. Recurrent attacks may lead to widespread alterations of the RPE and permanent central vision loss.
A number of mainly retrospective studies suggest that treatment with photodynamic therapy (PDT) using the photosensitizing drug verteporfin (Visudyne; Novartis, Basel, Switzerland) is effective in patients with CSC in reducing subretinal fluid, with an improvement of retinal anatomy, visual acuity, and retinal sensitivity. PDT seems to reduce the leakage from the RPE as well as the recurrence rate by decreasing the hyperpermeability in the choroid.
By using enhanced depth imaging optical coherence tomography (EDI-OCT), it has been reported that subfoveal choroidal thickness is increased in CSC eyes compared with normal eyes. Maruko and associates, using EDI-OCT, first reported that subfoveal choroidal thickness decreased following a half dose of PDT in patients with CSC. However, EDI-OCT, which is coupled to multiple averaging to achieve high contrast and low speckle noise, results in less detailed raster scan images. For this reason, previous studies have focused on choroidal thickness at several points, mainly the subfovea.
The recently developed swept source (swept-OCT) uses a center wavelength of >1000 nm, instead of the currently more widely diffuse OCT probing light operated at approximately 800 nm. The higher penetration of the OCT probe operating in swept-OCT, at a longer wavelength, allows the entire choroid to be visualized. Therefore, swept-OCT, which is characterized by a high-speed scan rate and a relatively low sensitivity roll-off vs depth compared with the spectral-domain OCT, is able to produce a 3-dimensional (3D) high-contrast image of the choroid.
In this study we scanned the whole macular area of patients with CSC by high-penetrating swept-OCT using a 3D radial scan protocol. The resultant choroidal-thickness maps were used to investigate the relationship between choroidal thickness and angiographic changes before and after PDT.
Methods
Patient Selection
In this prospective study, consecutive patients presenting with unilateral treatment-naive active CSC were entered over a 6-month period at the Transparence Eye Clinic of Tours, France, and the University Eye Clinic of Creteil, France. Inclusion criteria were: age >18 years; diagnosis of active CSC for at least 1 month, defined as presence of subretinal fluid involving the macula and associated with idiopathic leaks from the RPE during fluorescein angiography (FA). Exclusion criteria were any prior treatment (such as laser photocoagulation, photodynamic therapy, or intravitreal injections of anti-VEGF), and presence of subretinal fluid due to causes other than CSC (such as polypoidal choroidal vasculopathy).
Informed consent was obtained from all patients in agreement with the Declaration of Helsinki for research involving human subjects. French Society of Ophthalmology Ethics Committee approval was obtained for this study.
Study Protocol
All patients underwent (before PDT) a complete ophthalmologic examination at study entry, including measurement of best-corrected visual acuity (BCVA) using standard early treatment of diabetic retinopathy study (ETDRS) charts, fundus biomicroscopy, and FA (in case of isolated points of leakage). Indocyanine green angiography (ICGA) was performed in association with FA, in case of diffuse or poorly defined regions of leakage originating from broad areas of RPE damage. All patients also underwent swept-OCT, a system previously described in detail (Topcon, Tokyo, Japan), which uses the light source of a wavelength-sweeping laser centered at 1050 nm and having a tuning range of 100 nm. This system has a scanning speed of 100 000 A-scans per second and a scan window depth of 2.6 mm. The axial and transverse resolutions are 8 mm and 20 mm in tissue, respectively. The swept-OCT examinations were performed by trained examiners after pupil dilation. A 3D imaging data set was acquired for each subject (both eyes) using a radial scan protocol of 12 lines (12 mm B-scans, each composed of 1024 A-scans) through the fovea were obtained, and 32 B-scan images were averaged to reduce speckle noise. The centration of the scan was achieved by an internal fixation target and confirmed by a camera built-into the swept-source OCT system.
All patients were treated with FA/ICGA-guided verteporfin (6 mg/m 2 ) PDT (Visudyne; Novartis Pharma, New York, NY, USA), with a half-fluence rate (25 J/cm 2 ). Angiographic features (presence of leakage and choroidal vascular abnormalities or RPE atrophic changes) were evaluated by an experienced ophthalmologist (GQ) who was unaware of the swept-OCT results. The area of choroidal vascular abnormality on FA or ICGA (35 degree image-field setting) was measured with the built-in measurement software (IMAGEnet system; TRC-50IX; Topcon, Tokyo, Japan). Then a calibrated Opal PDT-Laser (Coherent, Santa Clara, CA, USA) and an indirect condensing laser lens (Mainster Wide Field; Ocular Instruments, Bellevue, WA, USA) were used for the PDT procedure. The infusion of verteporfin was performed for 10 minutes, and 15 minutes after the start of the infusion, a laser light at 689 nm was delivered at 25 J/cm 2 , with an intensity of 300 mW/cm 2 for 83 seconds.
All patients underwent repeated 3D swept-OCT assessment in the treated eye (study eye) at both 7 days and 30 days after PDT.
Morphologic Changes Analysis by Swept-OCT
Each 3D swept-OCT imaging covered a circle area of 12 mm in diameter centered on the fovea. In each image of the 3D data set, the macular thickness was measured as the distance between 2 lines automatically determined, corresponding to the inner limiting membrane and the inner border of the RPE-Bruch membrane complex. Similarly, in each image of the 3D data set, the choroidal thickness was measured as the distance between 2 lines automatically determined, representing the outer border of the RPE-Bruch membrane complex and the chorioscleral border ( Figure 1 ). Each line automatically determined was then manually corrected for any errors by one of the authors (SR).
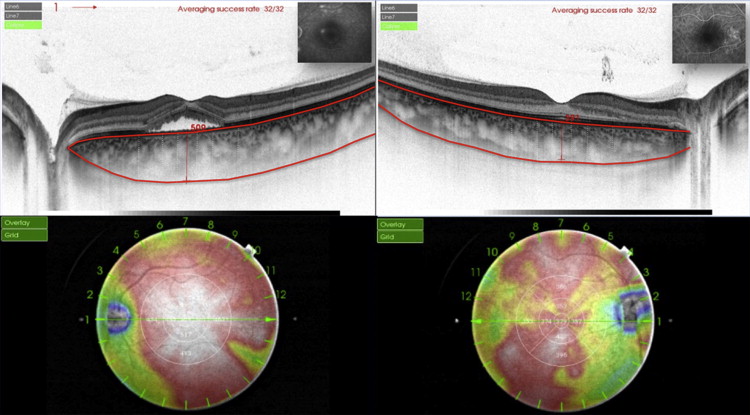
From all 12 images of each 3D data set, automated built-in calibration software (software v 9.00.003.17; Topcon) was used to determine the distance between the lines and to create 12 mm circular macular thickness and choroidal thickness maps. False colors were determined, starting from cool colors and progressing to warm colors (at the range of 0 to 500 μm), and ETDRS sectors (6 × 6 mm) were applied to the choroidal thickness map ( Figure 1 ). The mean thickness of each sector was automatically measured in the center sector within 1 mm from the center of the fovea; in 4 inner-ring sectors (superior, inferior, nasal, and temporal) 1 to 2 mm from the center of the fovea; and in 4 outer ring sectors (superior, inferior, temporal, and nasal) 2 to 3 mm from the center of the fovea.
The height of the serous retinal detachment, defined as the distance between the RPE and the bottom of the detached neurosensory retina just beneath the fovea, and the choroidal thickness in the center of the fovea, as well as in 4 sectors (superior, inferior, nasal, and temporal) at 1, 2 and 3 mm from the center of the fovea, were manually measured using the built-in caliper software (software v 9.00.003.17; Topcon) ( Figure 1 ) by 2 independent readers (SR, EHS). Mean observed values were considered.
Statistical Analysis
Statistical calculations were performed using Statistical Package for Social Sciences (v 17.0; SPSS, Chicago, IL, USA). All data are presented as mean ± standard deviation (SD). The Wilcoxon signed-rank test was used to evaluate changes in mean BCVA (logarithm of the minimum angle of resolution [logMAR]); mean macular thickness; and mean choroidal thickness (both automatically and manually measured) from study entry to day 7 and day 30 after PDT. At study entry, the Student t test was used for comparison of mean choroidal thickness at the center of the fovea and at each sector (superior, inferior, nasal, and temporal) between study eyes and fellow eyes. The mean choroidal thickness of areas characterized by angiographic abnormalities was compared, using t test analysis, to the mean choroidal thickness of areas without them (comparing choroidal values of affected areas with the average choroidal values of all unaffected areas). The Spearman correlation test was performed to evaluate the agreement between automatic and manual measurements of mean choroidal thickness at study entry (for both study and fellow eyes), at day 7 and at day 30 (for study eyes). The chosen level of statistical significance was P < 0.05.
Results
Patient Demographics and Main Clinical Findings at Study Entry
Twelve eyes of 12 patients (2 females, 10 males; mean age, 55.6 ± 14.0 years; range, 36–79 years) diagnosed with active CSC fulfilled the inclusion/exclusion criteria entered the study ( Table 1 ). At study entry, symptoms related to CSC were reported to last from a mean of 2.7 ± 1.7 months (median, 2.4 months; range, 1–6 months). Mean BCVA at study entry was significantly worse in the study eyes as compared to fellow eyes (0.22 ± 0.23 logMAR vs 0.03 ± 0.04 logMAR, respectively; P = 0.014). Mean choroidal thickness automatically measured in the center of the fovea at study entry was significantly thicker in the study eyes as compared to fellow eyes (420.7 ± 107.5 μm vs 349.2 ± 109.7 μm, respectively; P = 0.016) ( Figure 1 ).
| Study Entry | 30 Days | |||||
|---|---|---|---|---|---|---|
| Study Eyes | Fellow Eyes | P value a | Study Eyes | Fellow Eyes | P value a | |
| Inner superior | 413.5 ± 93.1 μm | 344.2 ± 86.9 μm | 0.005 | 356.7 ± 100.5 μm | 336.1 ± 88.9 μm | 0.16 |
| Inner inferior | 422.9 ± 106.6 μm | 357.1 ± 109.5 μm | 0.016 | 366.3 ± 107.8 μm | 351.8 ± 103.6 μm | 0.275 |
| Inner nasal | 401.9 ± 93.8 μm | 324.3 ± 104.5 μm | 0.012 | 358.7 ± 96.3 μm | 304.3 ± 101.8 μm | 0.038 |
| Inner temporal | 414.5 ± 116.2 μm | 344 ± 107.1 μm | 0.009 | 353.8 ± 116.7 μm | 339.1 ± 99.4 μm | 0.288 |
| Outer superior | 396.7 ± 77.4 μm | 326.2 ± 68.1 μm | 0.002 | 347.3 ± 79.6 μm | 303.3 ± 72.4 μm | 0.036 |
| Outer inferior | 392.7 ± 94.5 μm | 333 ± 103.7 μm | 0.006 | 344.2 ± 96.9 μm | 324.6 ± 98.8 μm | 0.116 |
| Outer nasal | 333.2 ± 86.8 μm | 268 ± 96.1 μm | 0.006 | 298.3 ± 90.2 μm | 255 ± 101.3 μm | 0.022 |
| Outer temporal | 393.1 ± 104.5 μm | 322.3 ± 95.1 μm | 0.005 | 344.1 ± 108.4 μm | 312.3 ± 95.4 μm | 0.081 |
Stay updated, free articles. Join our Telegram channel

Full access? Get Clinical Tree


