Purpose
To evaluate the efficacy of an iPod application developed to rapidly measure approximate visual acuity (VA).
Design
Prospective, cross-sectional study.
Methods
One hundred four subjects (104 eyes) with a wide range of VA underwent both Early Treatment Diabetic Retinopathy Study (ETDRS) VA testing and iPod application testing. The application presented 4 randomized ETDRS letters at the Snellen equivalent of 20/40 and 20/200 each. In separate analyses, sensitivity and specificity of the iPod test were determined using the ETDRS VA testing results as the gold standard and defining “failure” to see as identifying 1, 2, 3, or all 4 letters incorrectly out of 4 trials. The minimum number of iPod trials necessary to maintain high accuracy was determined by defining a “failure” as getting the first, first 2, first 3, or all trial letters incorrect. In 13 subjects, the time necessary to perform the testing was determined.
Results
Forty-six subjects had an ETDRS Snellen equivalent VA ≥20/40; 45 had a VA <20/40 and ≥20/200; and 13 had a VA <20/200. The mean ± SD testing time for the 3 groups was 43 ± 13, 60 ± 15, and 72 ± 25 seconds, respectively. The highest sensitivity and specificity combination was observed when a “failure” was defined as getting all letters incorrect for both the 20/40 (sensitivity = 98.3%/specificity = 93.5%) and 20/200 (sensitivity/specificity both 92.3%) cutoffs.
Conclusions
An iPod application requiring about a 1-minute testing time provides an objective, portable, rapid, and low-cost method to determine approximate VA, allowing VA testing to be performed efficiently in large surveys and other settings where approximate VA should be measured.
Vision loss is associated with functional limitations, and persons with visual impairment are at greater risk of injurious accidents and premature mortality. For these and other reasons, the assessment of visual impairment is a key component of clinical care as well as research aimed at quantifying the magnitude of impairment and the impact such impairment has on populations.
Current surveys for tracking vision and eye health in the United States are limited and do not provide adequate information to guide interventions and policy decisions. Most public health surveys (eg, the National Health Interview Survey [NHIS], the National Health and Nutrition Examination Survey [NHANES], and the Behavioral Risk Factor Surveillance System Survey [BRFSS]) and health encounter datasets (eg, the Medical Expenditure Panel Survey [MEPS] and Medicare Current Beneficiary Survey [MCBS]) rely in large part on self-reported visual function questionnaires to determine the level of vision in study participants. These surveys use questions that are subjective and at times unclear, many of the currently used questions have not been validated, and the questions and responses often differ across surveys. Even if questions of this sort are made less subjective and applied more consistently in surveys, it is likely that there will remain discrepancies between self-reported visual function or status and results of objective tests of vision and function.
For these reasons, objective vision testing methods in surveys where face-to-face interviews take place would be an improvement. The most common assessment of visual function is visual acuity (VA), which is typically tested using eye charts that are placed several meters away from the person being examined, limiting the use of this method in public health surveys. In order to simplify VA testing during in-person surveys, we developed a streamlined approach using an application on an iPod with the aim of determining which persons have poor vision (worse than 20/200), decreased vision (worse than 20/40 but equal to or better than 20/200), or good vision (20/40 or better). This approach could provide an objective, portable, quick, and low-cost way to determine approximate VA, one that can be used efficiently during large national surveys. Here, we describe the results from the initial testing of this application in patients with a wide range of VAs.
Methods
Subject Recruitment
In this cross-sectional cohort study, a convenience sample of 104 participants was selected from tertiary referral glaucoma and retina practices. The Johns Hopkins Institutional Review Board approved the study, written consent was obtained from all subjects, and the study was HIPAA compliant.
Application
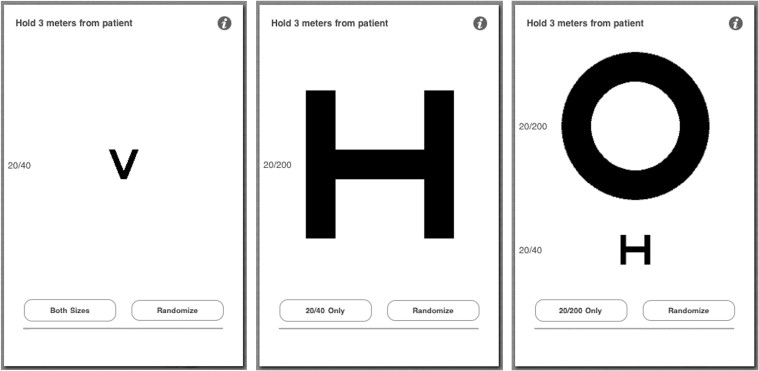
An application developer at Dok LLC (M.L.) assisted us in developing an iOS4 application that could be used on the iPod touch 5 (Apple Inc., Cupertino, California, USA) with the aim of determining which persons have poor vision (worse than 20/200), decreased vision (worse than 20/40 but better than or equal to 20/200), or good vision (20/40 or better). This application consisted of 3 screens: 1 with a 20/40 letter ( Figure 1 , Left), 1 with a 20/200 letter ( Figure 1 , Middle), and 1 with a 20/40 and a 20/200 letter ( Figure 1 , Right). Each letter was randomizable, with each randomization an independent event selecting 1 of 10 Early Treatment Diabetic Retinopathy Study (ETDRS) letters. The ETDRS chart is a standardized chart for VA testing, and is accepted worldwide as the gold standard for accurate VA testing.
Visual Acuity Testing
Patient eligibility was determined based on the results of the Snellen acuity testing that is routinely performed at each clinic visit. One eye was chosen for each subject, and subjects with a wide range of Snellen acuities were tested. All testing was performed with the subjects’ habitual correction in the same dark room illuminated only by the iPod screen or the retroilluminated ETDRS chart in a single testing session.
Standard Early Treatment Diabetic Retinopathy Study Acuity Testing
Visual acuity was tested using a retroilluminated 3-meter ETDRS chart (Precision Vision, La Salle, Illinois, USA) placed 3 meters from the patient. Patients were instructed not to lean forward during the testing and to read the chart at a pace comfortable for them. We converted the acuities to the logarithm of the minimal angle of resolution (logMAR) for use in statistical analysis.
Application Testing
All iPod testing was performed with the device at maximal brightness (500 cd/m 2 for the fifth-generation iPod Touch used in this study). To avoid bias, a second person who was masked to the VA results from ETDRS and Snellen testing performed the testing using the iPod. An eye patch was placed over the eye not being tested. Patients were asked to hold one end of a 3-meter string that had its other end attached to the iPod next to the eye being tested and the person testing the patient stood with the iPod at the distance where the string was taut. Patients were informed that they would be shown several letters on the iPod and were instructed to take their best guess at each letter. Subjects were shown individual letters at the 20/40 level 1 letter at a time for a total of 4 letters. If all of the letters were correctly identified, no further testing was performed. If, however, the subject was unable to identify even 1 of the 4 letters correctly, 4 letters at the 20/200 level were shown to the patient. We recorded each letter presented and whether the patient identified the letter correctly or not for all testing.
In 13 additional subjects—4 with VA 20/40 or better, 5 with VA worse than 20/40 but better than or equal to 20/200, and 4 with VA worse than 20/200—we timed the iPod test. The timer was begun after the subject had been seated, informed consent had been obtained, and the eye not being tested had been occluded.
Data Analysis
Statistical analysis was performed using STATA 12.1 (StataCorp LP, College Station, Texas, USA). We classified participants into 3 categories: good vision (equal to or better than 20/40), decreased vision (worse than 20/40 but equal to or better than 20/200), and poor vision (worse than 20/200) using the ETDRS VA as the reference test. Sensitivity and specificity of the iPod test for cutoff points were calculated against the reference test. Separate analyses were performed defining a “failure” (a positive result) for the iPod test as identifying any 1, 2, 3, or all 4 letters incorrectly out of four trials. We also assessed the minimum number of iPod trials necessary to maintain high accuracy. To do so, we performed separate analyses defining “failure” to see as getting the first trial letter incorrect, getting the first 2 letters incorrect, getting the first 3 letters incorrect, and getting all letters incorrect.
Results
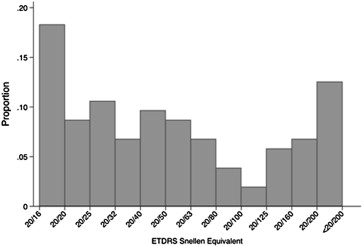
Of the 104 subjects enrolled, 63 percent were female and 69 percent were non-Hispanic white ( Table 1 ). Forty-six subjects had an ETDRS Snellen equivalent VA ≥20/40, 45 had a VA <20/40 and ≥20/200, and 13 had a VA <20/200 ( Figure 2 ).
| Characteristic | Value |
|---|---|
| Age (y), mean ± SD | 67.3 ± 15.4 |
| Female, n (%) | 65 (62.5) |
| Race, n (%) | |
| Non-Hispanic white | 72 (69.2) |
| Black | 26 (25.0) |
| Hispanic | 3 (2.9) |
| Asian or Pacific Islander | 3 (2.9) |
| ETDRS VA (logMAR), mean ± SD | 0.48 ± 0.39 |
| ETDRS VA, n (%) | |
| ≥20/40 | 46 (44.2) |
| <20/40 to ≥20/200 | 45 (43.3) |
| <20/200 | 13 (12.5) |
All participants were asked to identify 4 ETDRS typeface letters at the 20/40 level from the iPod ( Tables 2 and 3 ). When a positive test result (ie, a test result that identified a person with decreased vision correctly) was defined as getting only 1 of the 4 letters incorrect, all 58 subjects with ETDRS vision worse than 20/40 were correctly identified as being unable to see 20/40 or better (sensitivity = 100%); however, with this relatively low requirement to fail, only 28 of the 46 subjects with ETDRS vision 20/40 or better were correctly identified as having vision at this level (specificity = 60.9%, Table 2 ). When 3 of 4 letters were required to be incorrect to classify an individual as having vision worse than 20/40, 57 of the 58 subjects with ETDRS vision <20/40 correctly tested positive (sensitivity = 98.3%); the 1 subject with ETDRS vision worse than 20/40 who incorrectly tested negative had an ETDRS VA of 20/50. With this requirement, 42 out of 46 subjects with ETDRS vision 20/40 or better correctly tested negative (specificity = 91.3%). When the requirement was made even more stringent and the subject had to incorrectly identify all 4 letters to be considered unable to see 20/40 or better, the same 57 of 58 subjects correctly tested positive (sensitivity = 98.3%), but 1 additional subject correctly tested negative (43/46 subjects, specificity = 93.5%); of the 3 subjects with ETDRS vision of 20/40 or better who failed to identify all 4 letters presented, 2 had an ETDRS VA of 20/40 and 1 had an ETDRS VA of 20/25. Finally, when a positive test result was defined by all incorrect responses for the first X number of trials, requiring all 4 trials to be incorrect again yielded the best sensitivity and specificity combination (sensitivity = 98.3% and specificity = 93.5%). Requiring the first 3 trials to be incorrect resulted in the same sensitivity and specificity as requiring 3 out of 4 trials to be incorrect (sensitivity = 98.3% and specificity = 91.3%).
| Least Number Required to Be Incorrect out of 4 Trials | ||||
|---|---|---|---|---|
| 1 of 4 Trials Incorrect | 2 of 4 Trials Incorrect | 3 of 4 Trials Incorrect | 4 of 4 Trials Incorrect | |
| Sensitivity | 100.0% (58/58) | 98.3% (57/58) | 98.3% (57/58) | 98.3% (57/58) |
| Specificity | 60.9% (28/46) | 80.4% (37/46) | 91.3% (42/46) | 93.5% (43/46) |
| ETDRS VA of false positives | ||||
| 20/40 | 38.9% (7/18) | 33.3% (3/9) | 50.0% (2/4) | 66.6% (2/3) |
| 20/32 | 33.3% (6/18) | 44.4% (4/9) | 25.0% (1/4) | – |
| 20/25 | 27.8% (5/18) | 22.2% (2/9) | 25.0% (1/4) | 33.3% (1/3) |
| ETDRS VA of false negatives | ||||
| 20/50 | – | 100.0% (1/1) | 100.0% (1/1) | 100.0% (1/1) |
| All Incorrect Responses for the First X Number of Trials | ||||
|---|---|---|---|---|
| Trial 1 Incorrect | Trials 1 & 2 Incorrect | Trials 1-3 Incorrect | Trials 1-4 Incorrect | |
| Sensitivity | 98.3% (57/58) | 98.3% (57/58) | 98.3% (57/58) | 98.3% (57/58) |
| Specificity | 76.1% (35/46) | 87.0% (40/46) | 91.3% (42/46) | 93.5% (43/46) |
| ETDRS VA of false positives | ||||
| 20/40 | 36.4% (4/11) | 33.3% (2/6) | 50.0% (2/4) | 66.6% (2/3) |
| 20/32 | 27.2% (3/11) | 33.3% (2/6) | 25.0% (1/4) | – |
| 20/25 | 36.4% (4/11) | 33.3% (2/6) | 25.0% (1/4) | 33.3% (1/3) |
| ETDRS VA of false negatives | ||||
| 20/50 | 100.0% (1/1) | 100.0% (1/1) | 100.0% (1/1) | 100.0% (1/1) |
Twenty-eight participants, all with ETDRS VA better than 20/40, were able to correctly identify all 4 letters tested at the 20/40 level; the other 76 participants were asked to read 4 ETDRS typeface letters at the 20/200 level from the iPod. When all participants were included in the analysis, the best combination of sensitivity and specificity was again observed when a positive test result was defined as getting all 4 letters incorrect ( Table 4 ). With this requirement, 12 of the 13 subjects with ETDRS vision worse than 20/200 correctly tested positive (sensitivity = 92.3%), while 84 out of 91 subjects with vision better than or equal to 20/200 correctly tested negative (specificity = 92.3%). Of the 7 subjects with vision ≥20/200 who incorrectly tested positive (ie, tested as if they had VA <20/200), 3 had an ETDRS VA of exactly 20/200 and 2 had a VA of 20/160, similar to the 20/200 cutoff; the other 2 subjects had VAs of 20/125 and 20/100. When a positive test result was defined by all incorrect responses for the first X number of trials, requiring all 4 trials to be incorrect again yielded the best combination of sensitivity and specificity (both 92.3%, Table 5 ). Requiring trials 1-3 to be incorrect also resulted in a relatively high sensitivity and specificity (92.3% and 91.2%, respectively). When only the 58 participants with ETDRS VA worse than 20/40 were included in the analysis, requiring all 4 trials to be incorrect at the 20/200 level resulted in a sensitivity of 92.3% and a specificity of 84.4% ( Supplemental Table 1 , available at AJO.com ). Results were similar when requiring the first 3 trials to be incorrect ( Supplemental Table 2 , available at AJO.com ).
| Least Number Required to Be Incorrect out of 4 Trials | ||||
|---|---|---|---|---|
| 1 of 4 Trials Incorrect | 2 of 4 Trials Incorrect | 3 of 4 Trials Incorrect | 4 of 4 Trials Incorrect | |
| Sensitivity | 92.3% (12/13) | 92.3% (12/13) | 92.3% (12/13) | 92.3% (12/13) |
| Specificity | 79.1% (72/91) | 83.5% (76/91) | 86.8% (79/91) | 92.3% (84/91) |
| ETDRS VA of false positives | ||||
| 20/63 | 10.5% (2/19) | – | – | – |
| 20/80 | 5.3% (1/19) | – | – | – |
| 20/100 | 10.5% (2/19) | 6.7% (1/15) | 8.3% (1/12) | 14.3% (1/7) |
| 20/125 | 10.5% (2/19) | 13.3% (2/15) | 8.3% (1/12) | 14.3% (1/7) |
| 20/160 | 31.6% (6/19) | 40.0% (6/15) | 41.7% (5/12) | 28.6% (2/7) |
| 20/200 | 31.6% (6/19) | 40.0% (6/15) | 41.7% (5/12) | 42.9% (3/7) |
| ETDRS VA of false negatives | ||||
| <20/200 | 100.0% (1/1) | 100.0% (1/1) | 100.0% (1/1) | 100.0% (1/1) |
Stay updated, free articles. Join our Telegram channel

Full access? Get Clinical Tree


