Purpose
To develop a new objective method for measuring ocular oblique muscle dysfunction.
Design
Prospective, observational study.
Methods
Twelve healthy volunteers and 27 patients with oblique muscle overaction or underaction in at least 1 eye were included. The corneal contour in 9-gaze photographs was transcribed into an ellipse. A newly developed simulating program depicted the corneal contour as the eyes moved, and graded oblique muscle dysfunction by analyzing the angular difference between the 2 eyes. An angular difference of 5 degrees was defined as 1 unit of overaction or underaction. To verify the accuracy of the method, a masked observer compared the photographic analysis with goniometric readings in the model eye and magnetic search coil recordings in healthy volunteers. The diagnostic accuracy of the photographic analysis was compared with the clinical gradings of patients with oblique muscle overaction or underaction.
Results
There was no statistical difference between photographic analysis and goniometric readings of the model eye. Bland-Altman plots showed that there was no overall tendency for the photographic analysis to differ from the scleral search coil values, and the difference fell mostly within ±7 degrees. There was a good correlation between the photographic analysis and the clinical grading of oblique muscle dysfunction ( R 2 = 0.618; P < .001). The sensitivity and specificity for detecting oblique muscle overaction were 90.2% and 88.1%, respectively, whereas those for detecting underaction were 81.5% and 80.2%, respectively.
Conclusions
A newly developed photographic analysis could provide an objective and accurate means of evaluating ocular oblique muscle dysfunction.
The evaluation of ocular oblique muscle dysfunction is important in the diagnosis and treatment of strabismus. The choice of surgical techniques depends on the type and amount of dysfunction measured by clinical grading scales. However, the evaluation of ocular oblique muscle dysfunction is subjective, and many physicians have their own scheme for evaluating ductions and versions and comparing the differences between the 2 eyes. Thus, the current clinical grading of extraocular muscle dysfunction depends, to a great extent, on the examiner’s judgment and is subject to interobserver variability.
Previous studies have graded ocular oblique muscle overaction and underaction in the primary position and in the fields of action of the oblique muscles; however, the subjective nature and interobserver variability of clinical gradings make it difficult to obtain reliable and accurate measurements. A recent study objectively measured the degree of inferior oblique muscle overaction by image analysis on photographs and showed significant correlation with the clinical grading scale. However, this study used a 2-dimensional eye model, required additional images of the primary position that may not always be available in patients with constant strabismus, did not compare the results with a gold standard method of measuring ocular movements other than clinical grading scales, and was limited to patients with inferior oblique overaction. Therefore, in the current study, we developed a novel method to measure ocular oblique muscle dysfunction objectively based on a 3-dimensional eye model using simple photographic analysis of the corneal contour.
Methods
This study adhered to the Declaration of Helsinki and the protocol was approved by the Institutional Review Board of Seoul National University Bundang Hospital. Twelve healthy volunteers without any ocular problems and 27 patients with ocular oblique muscle overaction or underaction in at least 1 eye were included in this study. Full-face photographs were obtained at a distance of 1 m from the subject using an 8.2-megapixel digital single-lens reflex camera (EOS20D; Canon, Inc, Tokyo, Japan) with a ring flash attached on the lens. The patient’s head was stabilized with a head and chin rest and was instructed to look at a fixation target at 9 cardinal gazes.
Photographic Analysis
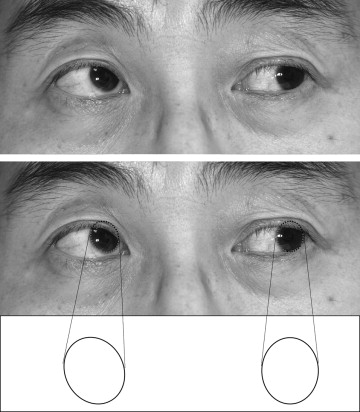
In the interest of drawing the corneal contour in 2-dimensional photographs, the corneal margin was captured using Adobe Illustrator CS version 12.0.0 (Adobe Systems, San Jose, California, USA). The curved line of the corneal margin that was visible from the original photograph was separated ( Figure 1 ). A full ellipse was extrapolated from the remaining part of the corneal margin so the corneal contour could be drawn. This had to be done because the elliptical corneal contour was not fully visible in the photographs to eyelid covering.
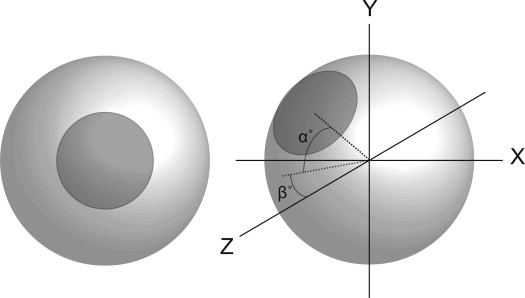
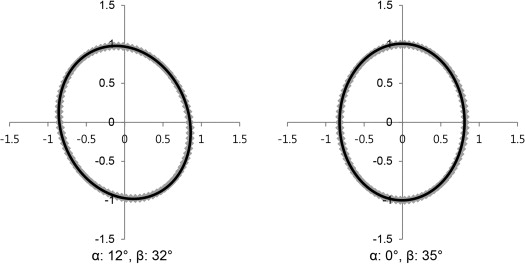
A simulating program presenting a rotating circle based on the intended longitude (angle of horizontal deviation) and latitude (angle of vertical deviation) was developed using the polar coordinate system. The center of the inner circle representing the cornea was expressed as polar coordinates. The ratio of this circle’s horizontal diameter and vertical diameter was based on the general corneal contour of 11.5:10. If the circle rotated α degrees around the x-axis and −β degrees around the y-axis, and then the circle was projected onto the x-y plane, an ellipse was presented that coincided with the 2-dimensional photographic image of the cornea ( Figures 2 and 3 ). This was implemented using Microsoft Excel Visual Basic Editor (Microsoft Corporation, Redmond, Washington, USA).
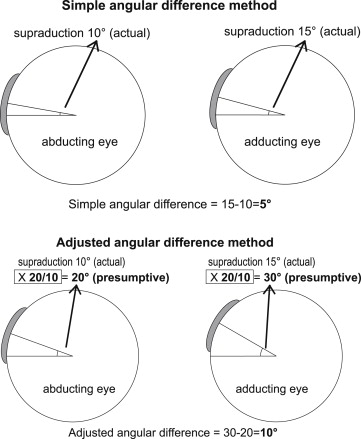
Using the newly designed program simulating the projected image of the cornea rotating in 3 dimensions, the degree of elevation or depression (α) in both eyes could be calculated when the ellipse matched with the corneal contour of the photographs. The α difference between the 2 eyes (adducting eye − abducting eye) then was calculated, defined as the simple angular difference method. A positive value of α difference of the adducting eye was determined as overaction, and a negative value was determined as underaction. The simple angular method was applied readily on photographs obtained during adduction in the primary position without vertical rotation of the abducting eye. In contrast, if the eye looked upward or downward during adduction, the abducting eye theoretically should rotate exactly the same amount as the target. However, this is not, in fact, what happens, and the amount of vertical deviation of the abducting eye may be less or more than the intended fixation point of the target. Considering the fact that the degree of ocular oblique muscle dysfunction maximizes in the direction of muscle action, and based on Hering’s law of equal innervation to both eyes, the degree of ocular oblique muscle dysfunction may be affected by the amount of vertical rotation of the abducting eye. Therefore, we set a standardized position of vertical deviation at 20 degrees and adjusted the results of simple angular difference according to the actual vertical deviation of the abducting eye, defined as the adjusted angular difference method. For example ( Figure 4 ), if the abducting right eye is elevated 10 degrees and the adducting left eye is elevated 15 degrees during adduction, the simple angular difference in elevation is: 15 degrees − 10 degrees = 5 degrees of left inferior oblique overaction. If the vertical position of the abducting right eye is adjusted to 20 degrees, the adjusted angular difference is: simple angular difference (5 degrees) × 20 degrees / vertical angle of the abducting eye (10 degrees) = 10 degrees ( Figure 4 ). Ocular oblique muscle dysfunction was measured using these 2 methods simultaneously when applicable.
Comparison Between Photographic Analysis and the Model Eye
We applied photographic analysis to a model eye to evaluate the accuracy of photographic analysis. A model eye was made that freely rotated and displayed goniometric readings of the center of the cornea in longitude (angle of horizontal deviation along the x-axis) and latitude (angle of vertical deviation along the y-axis). To generate standard photographs for analysis, the model eye was rotated in a stepwise manner by 5-degree intervals from 0 to 30 degrees along the horizontal and vertical axis. All possible combinations of horizontal and vertical vectors were applied, and 36 photographs were generated in each quadrant. Finally, a total of 144 photographs were presented in random order for analysis. A masked observer (H.K.Y.) measured the longitude (horizontal deviation) and latitude (vertical deviation) on each photograph using photographic analysis. The goniometric readings of the model eye were compared with the angles obtained by photographic analysis.
Comparison Between Photographic Analysis and the Scleral Search Coil
Twelve healthy volunteers recorded 2-dimensional scleral search coils in both eyes simultaneously. The camera was placed at 1 m in front of each subject. A frame with a target at 4 fixation points (20 degrees right/20 degrees up, 20 degrees right/20 degrees down, 20 degrees left/20 degrees up, 20 degrees left/20 degrees down) was used. Photographs were obtained while the subject viewed the 4 fixation points. During the test, 2 subjects could not record the magnetic scleral search coil because of discomfort and 1 subject’s data was discarded because of sudden coil breakage. Finally, 9 volunteers (4 men and 5 women; age range, 23 to 48 years; mean age, 28.3 years) completed the test and a total of 36 photographs were gathered from 9 volunteers. At each fixation point, the horizontal and vertical angles of the scleral search coil were compared with the angles obtained by photographic analysis. The level of agreement between the scleral search coil and photographic analysis was assessed using Bland-Altman analysis.
Comparison Between Photographic Analysis and Clinical Evaluation
Photographic analysis of ocular oblique muscle overaction or underaction and the clinical gradings from medical records were compared in patients. Nine-gaze photographs were obtained on the same day the patients were examined. All gradings of oblique muscle dysfunction were made by 1 examiner (J.-M.H.). A total of 27 patients (17 men and 10 women; age range, 3 to 27 years; mean age, 9.1 years) were included in the study. For photographic analysis, inferior oblique overaction was measured from photographs during ipsilateral adduction in the primary position, inferior oblique underaction was measured during ipsilateral adduction in upward gaze with the simple and adjusted angular difference methods, and superior oblique overaction and underaction were measured during ipsilateral adduction in downward gaze with the simple and angular difference methods. A total of 162 photographs were obtained for analysis (6 photographs in each of 27 patients). An angular difference of 5 degrees was defined as 1 unit of overaction or underaction. Spearman correlation coefficients were determined between the clinical gradings and photographic analysis. Nonparametric analysis of clustered receiver operating characteristic curves was used to determine the diagnostic accuracy of the test.
Statistical Analysis
SPSS for Windows software version 18.0 (SPSS, Inc, Chicago, Illinois, USA) and SAS software version 9.1 (SAS Institute, Inc, Cary, North Carolina, USA) were used for statistical analysis. Measurements of photographic analysis were compared with goniometric readings of the model eye by paired t test. The level of agreement between the scleral search coil and photographic analysis was assessed using Bland-Altman analysis. Spearman correlation coefficients were determined between photographic analysis and clinical gradings. Nonparametric analysis of clustered receiver operating characteristic curves and the area under the receiver operating characteristic curve (AUC) were analyzed to determine the diagnostic accuracy of the photographic analysis compared with clinical gradings.
Stay updated, free articles. Join our Telegram channel

Full access? Get Clinical Tree


