Purpose
To identify the 23 amino acid profiles in human tear fluids, and to evaluate whether the ocular disease conditions reflect the amino acid profiles.
Design
Laboratory investigation.
Methods
We evaluated the concentrations and relative composition of 23 amino acids in tear fluids obtained from 31 healthy volunteers using reversed-phase high-performance liquid chromatography and electrospray ionization tandem mass spectrometry, and compared them with those in plasma and aqueous humor. We also evaluated the tear-fluid amino acid profiles from 33 affected subjects.
Results
The amino acid profiles of the basal tear and reflex tear were found to be similar, and 4 distinct groups of healthy volunteers (male, female, young, and elderly) showed similar profiles. Absolute concentrations of taurine (Tau) and L-glutamine were significantly dominant in these tear fluids. The relative compositions of Tau, L-glutamic acid, L-arginine (Arg), and citrulline in the tear fluid were significantly higher than those in the plasma and aqueous humor. Analysis of the hierarchical clustering of the amino acid profiles clearly distinguished severe ocular surface diseases from non–ocular surface diseases. The relative compositions of Tau, L-methionine, and Arg decreased in severe ocular surface disease subjects compared with non–ocular surface disease subjects.
Conclusions
Tear-fluid amino acid profiles differ from those in plasma and aqueous humor. Steady-state tear-fluid amino acid profiles might reflect ocular-surface homeostasis and the observed changes of amino acids might have a close relation with the disease conditions on the ocular surface.
Metabolism can be viewed as a network that can adapt to various nutritional conditions and that may become disturbed during disease and physiologic insults. Specific variations in amino acid profiles in blood have been reported in the context of liver failure, renal failure, cancer, diabetes, and so on. Conventionally, amino acid has long been considered a source of protein synthesis in the nutritional term, and the existence of a free amino acid supply to the tissues plays a pivotal role in maintaining organ and body protein homeostasis. However, besides their role as substrates for protein synthesis, amino acids have multiple and critical functions, not only in maintaining baseline steady-state homeostasis, but also in the pathophysiology of diverse human disorders. It is now widely accepted that changes in amino acid availability have profound effects on many aspects of cellular functions, including the regulation of cell signaling, gene expression, and the transport of amino acids themselves. For example, the pathophysiologic relevance of L-glutamine (Gln, GluNH2), L-arginine (Arg), and L-leucine (Leu) have been implicated in severely traumatized patients, in the inflammatory response, and in activating the mammalian target of rapamycin (mTOR).
Tear fluids provide oxygen and other nutrients, as well as chemical mediators including antimicrobial and immunologic mediators. Considering the relevance of amino acids and glucose in the homeostatic metabolism of tissues, the profound understanding of the function of amino acid in tear fluids is as crucial as that of chemical mediators. Previously, a few reports have presented contradicting results on the amount of a limited number of amino acids in human tears. The existence of a significantly higher concentration of L-valine (Val), L-isoleucine (Ile), and L-histidine (His) has been reported, and with the exception of L-aspartate (Asp), L-glutamic acid (Glu), and taurine (Tau), the quantities found in tears were at a comparable level with those found in plasma.
Today, amino acid profiles for biological specimens are commonly analyzed by ion-exchange chromatography, a method in which amino acids and related compounds can be measured. Recently, a new method for rapidly analyzing amino acids was developed that involves derivatization with a novel reagent, followed by reversed-phase high-performance liquid chromatography and electrospray ionization tandem mass spectrometry (HPLC/ESI-MS/MS). Now, more than 100 different analytes with amino groups can be measured within 10 minutes by the combination of the precolumn derivatization and HPLC/ESI-MS/MS techniques. This method represents an alternative to traditional amino acid analysis techniques. The aim of this study was to reveal and describe the amino acid profiles in human tear fluids since this new method now makes it possible to analyze samples in trace amounts (below 0.5 μL) and with a superior reproducibility. In addition, the possible physiological and pharmacologic function of amino acids will be discussed.
Methods
Normal Volunteer Subjects
Enrolled in this study were normal volunteer subjects with no corneal-, conjunctival-, or lacrimal-system abnormalities as assessed by slit-lamp examination. Free amino acids were evaluated in blood samples obtained from 11 healthy young male (mean age: 22.9 ± 1.4 years), 6 healthy young female (mean age: 21.0 ± 0.7 years), 6 healthy elderly male (mean age: 69.5 ± 3.8 years), and 11 healthy elderly female (mean age: 71.5 ± 4.0 years) volunteer subjects. Basal tear samples were collected from the young and elderly subjects (n = 31; young male: 10; young female: 6; elderly male: 6; elderly female: 9) and reflex tear samples were also collected from the young subjects (n = 16; male: 10; female: 6). Basal and reflex tear fluid samples (0.5−1.0 μL) were collected from the inferior tear meniscus of each subject using a microcapillary tube. Reflex-tear stimulation was initiated by inserting an applicator into the nose of each subject. Aqueous humor samples were obtained from the elderly subjects (n = 16; male: 6; female: 10) through the use of a 1-mL syringe with a 30-gauge needle prior to cataract surgery, and all of the obtained samples were free of contamination by blood fluids.
Preparation of Tear Fluid and Aqueous Humor Samples
Each tear sample was transferred into a 0.5-mL sterile microfuge tube and then centrifuged. Supernatants were stored at –70°C until assaying for the amino acid levels. After thawing, 0.5 μL of each tear sample was diluted with 4.5 μL of sterile purified water, and then extracted by the addition of 20 μL of acetonitrile and mixing with a vortex mixer. The samples were centrifuged at 10 000 rpm for 1 minute, and the supernatants were then analyzed. A quantity of 1.0 μL of aqueous humor was used for each sample, with the same dilution as that of the tear fluid.
Patients with Ocular Surface Disease and Corneal or Scleral Disease
Tear samples were collected from 33 affected subjects composed of 18 subjects with severe ocular surface diseases and 15 subjects with corneal or scleral diseases. Severe ocular surface diseases included Stevens-Johnson syndrome (SJS) (n = 10), chemical injury (n = 4), thermal burn (n = 2), and stem cell deficiency from an unknown cause (n = 2). The corneal or scleral diseases of the other 15 subjects included granular dystrophy (n = 2), band-shaped keratopathy (n = 2), keratoconus (n = 2), bullous keratopathy (n = 2), lattice dystrophy (n = 1), corneal erosion (n = 1), postcorneal infection (n = 2), necrotizing keratitis (n = 1), and scleritis (n = 2). Those 15 subjects were all classified as non–ocular surface disease.
Biochemical Assays of Tear Fluid Amino Acid and Aqueous Humor Amino Acid
For measurement of the amino acid concentration in the tear fluid and aqueous humor samples, we adopted precolumn derivatization with AccQ·Tag (Waters Corporation, Milford, Massachusetts, USA) to increase the ionization efficiency of the adducts before being analyzed by the multiple-reaction monitoring mode of reversed-phase HPLC HP1100 series (Agilent Technologies, Inc, Palo Alto, California, USA) and triple quadrupole tandem mass spectrometry (API4000 LC/MS/MS system; Applied Biosystems, Inc, Foster City, California, USA). For derivatization with 20 μL of AccQ·Tag reagent, 20 μL of a deproteinized tear sample was added to 60 μL of 0.2-M borate buffer (pH 8.8) and then heated at 55°C for 10 minutes. The reaction mixture was diluted with 100 μL of 0.2% acetic acid and 5 μL of the mixture was then injected onto the HPLC column (L-Column, 50 mm × 2.0 mm, 3-μm particles; Chemicals Evaluation and Research Institute, Tokyo, Japan) prior to MS detection at a flow rate of 0.25 mL/min.
Biochemical Assays of Plasma Amino Acid
The plasma was separated and deproteinized in a final concentration of 3% sulfosalicylic acid. All samples were stored at –70°C until measurement using HPLC (SRL Inc, Tokyo, Japan). The basic amino acid and related molecules (23 compounds) were measured and used in the analysis. Those compounds are as follows: L-tyrosine (Tyr), Val, Leu, L-methionine (Met), Ile, Gln, L-serine (Ser), L-lysine (Lys), L-asparagine (Asn, AspNH2), L-threonine (Thr), L-alanine (Ala), Glu, His, L-ornithine (Orn), L-cystine (Cys2), L-proline (Pro), L-tryptophan (Trp), Arg, Tau, glycine (Gly), citrulline (Cit), Asp, and L-phenylalanine (Phe).
Statistical Analysis
Statistical analysis was performed using SPSS statistical analysis software (SPSS Inc, Chicago, Illinois, USA). Hierarchical clustering analysis was performed using JMP7.0 software (SAS Institute, Inc, Cary, North Carolina, USA). The correlations among 23 amino acid concentrations as well as among plasma and/or ophthalmic fluid (basal tear, reflex tear, and aqueous humor) samples were clustered using the Ward method. For the red>gray>blue color system, the depth in the red color or blue color reflected the different degree of values above or below the mean (gray color), respectively. Graphic presentations of box plots were generated using R (R Foundation for Statistical Computing, Vienna, Austria). In each box plot, the top and bottom of the boxes were the first and third quartiles, respectively, and the length of the box represented the inter-quartile range within 50% of the values that were included. The horizontal line within each box represented the median, the vertical lines showed the largest/smallest observation that fell within a distance of 1.5 times the box size from the nearest quartile in the box, and the additional points were considered “extreme” values and are shown separately.
These presentations and analyses were performed based on each of the absolute amino acid concentrations (μM) or relative amino acid composition (percentage), calculated by each amino acid concentration/total 23 amino acid concentrations.
Results
Comparison of Amino Acid Profiles Among Tear Fluid, Aqueous Humor, and Plasma Samples of Normal Subjects
Amino acid concentrations in a trace amount of tear fluids of 0.5 to 1.0 μL were able to be measured reproducibly by HPLC/ESI-MS/MS. The reproducibility of the measurements was confirmed in separate experiments using normal tear fluids. The Table shows the concentrations of each amino acid in the basal tear, the reflex tear, the aqueous humor, and the plasma of normal subjects. A significant difference of amino acid profiles between the tear fluid, the aqueous humor, and the plasma samples was confirmed. The concentration of total amino acids in the tear fluid samples (means ± SEM: 382.1 ± 42.6 μM) was lower than that in the plasma samples (2961.6 ± 63.1 μM) but higher than that in the aqueous humor samples (81.6 ± 15.2 μM). Ala, Val, and Gln were dominant components in the plasma samples (more than 240 μM). Gly, Pro, and Lys were also major components in the plasma samples.
| Basal Tear (n = 31) | Reflex Tear (n = 16) | Aqueous Humor (n = 16) | Plasma (n = 34) | |
|---|---|---|---|---|
| Gly | 10.7 ± 2.8 | 14.4 ± 7.1 | 0.4 ± 0.1 | 231.3 ± 11.1 |
| Ala | 23.8 ± 4.8 | 19.5 ± 8.5 | 14.4 ± 2.7 | 385.5 ± 14.5 |
| Val | 3.5 ± 0.9 | 3.8 ± 1.4 | 6.7 ± 1.1 | 244.7 ± 8.5 |
| Leu | 10.1 ± 1.9 | 6.4 ± 1.9 | 3.3 ± 0.6 | 125.4 ± 6.1 |
| Ile | 1.1 ± 0.3 | 1.1 ± 0.5 | 1.5 ± 0.3 | 68.7 ± 3.6 |
| Ser | 14.4 ± 4.2 | 26.4 ± 13.0 | 3.9 ± 0.8 | 113.6 ± 3.3 |
| Thr | 5.4 ± 1.2 | 8.4 ± 3.6 | 3.5 ± 0.7 | 127.6 ± 3.8 |
| Met | 2.4 ± 0.1 | 2.2 ± 0.1 | 0.9 ± 0.2 | 28.1 ± 1.3 |
| AspNH2 (Asn) | 1.4 ± 0.3 | 1.5 ± 0.7 | 1.0 ± 0.2 | 49.6 ± 1.5 |
| GluNH2 (Gln) | 42.1 ± 6.8 | 25.4 ± 6.3 | 28.7 ± 5.2 | 589.5 ± 11.0 |
| Pro | 8.4 ± 1.4 | 6.7 ± 1.5 | 0.5 ± 0.1 | 180.2 ± 8.5 |
| Phe | 10.7 ± 1.9 | 5.7 ± 1.5 | 2.8 ± 0.5 | 63.7 ± 2.0 |
| Tyr | 1.3 ± 0.5 | 1.1 ± 0.5 | 2.8 ± 0.6 | 73.5 ± 3.8 |
| Trp | 7.1 ± 0.7 | 6.6 ± 1.0 | 0.9 ± 0.1 | 52.9 ± 1.8 |
| Asp | 13.2 ± 4.5 | 18.2 ± 11.6 | 0.0 ± 0.0 | 1.8 ± 0.2 |
| Glu | 30.2 ± 4.8 | 20.9 ± 4.8 | 0.1 ± 0.0 | 42.3 ± 2.8 |
| Lys | 5.7 ± 1.2 | 3.5 ± 1.2 | 3.1 ± 0.6 | 195.7 ± 7.2 |
| Arg | 18.7 ± 1.6 | 14.4 ± 2.5 | 2.5 ± 0.5 | 82.7 ± 3.0 |
| His | 1.9 ± 0.7 | 3.2 ± 1.9 | 1.5 ± 0.3 | 83.7 ± 2.0 |
| Cit | 10.1 ± 0.8 | 8.2 ± 1.5 | 1.2 ± 0.2 | 35.1 ± 1.7 |
| Orn | 3.3 ± 1.1 | 7.1 ± 3.0 | 0.4 ± 0.1 | 79.3 ± 4.9 |
| Cys2 | 1.0 ± 0.2 | 0.6 ± 0.2 | 0.3 ± 0.1 | 49.0 ± 2.4 |
| Tau | 195.1 ± 26.9 | 100.1 ± 18.7 | 1.2 ± 0.3 | 57.7 ± 2.0 |
In the tear fluids, Tau, Glu, and Gln were dominant components (more than 25 μM). Arg and Cit were of a higher concentration than other amino acid concentrations, whereas Val, Ile, Met, Asn, Tyr, His, and Orn were of a lower concentration (below 5 μM) ( Table , and Figure 1 , Top). Notably, the concentrations of Tau and Glu were significantly higher than (3.4 times higher) or comparable with (0.7 times higher) those in plasma samples. Asp also was of a higher value than that in plasma samples. The amino acid concentrations and profiles of the basal tear fluid and reflex tear fluid were found to be similar.
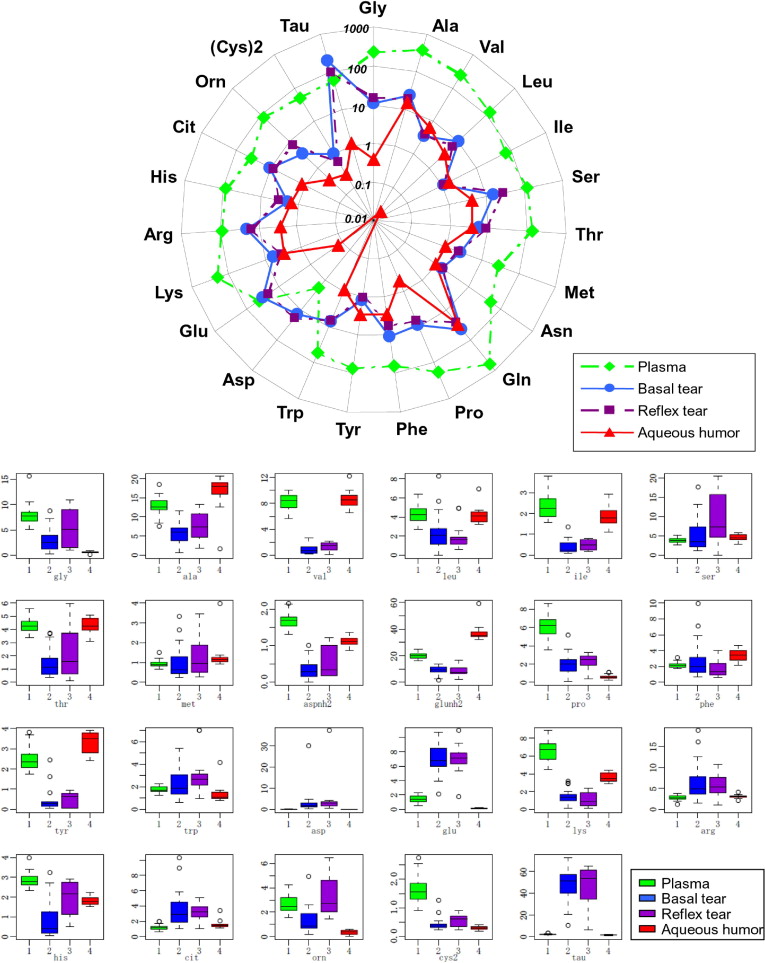
Since it has been shown that the metabolomic profiling of amino acid can be helpful in revealing specific physiological conditions or states, and that the ratios between some specific amino acids can be useful in diagnosing them, we performed some analyses based on not only amino acid concentrations but also relative amino acid composition ( Figure 1 , Bottom). The composition of amino acid in aqueous humors was rather analogous to that in plasmas, although the levels of Gly, Pro, and Orn were low. In the tear fluid samples, Tau and Glu were of a higher relative amino acid composition (25.0 times higher and 4.9 times higher, respectively; P < .001) (Tukey test) than those in the plasma samples, yet the aqueous humor samples were not (Tau: 0.73 times higher, Glu: 0.09 times higher). The relative compositions of Arg and Cit in the tear fluid samples were smaller but statistically significantly higher than those in the plasma and aqueous humor samples. There was no significant difference between the basal tear fluid and reflex tear fluid in 23 relative amino acid compositions (Tukey test).
In an aim to build up a simple visual presentation, the correlations among 23 amino acid concentrations and the relative amino acid composition of 31 basal tear fluid, 16 reflex tear fluid, 16 aqueous humor, and 34 plasma samples were clustered ( Figure 2 ). Plasma samples were clearly clustered at the highest position, followed by tear fluid samples and then aqueous humor samples.
Stay updated, free articles. Join our Telegram channel

Full access? Get Clinical Tree


