Purpose
To report the baseline characteristics of the participants in the Advanced Imaging for Glaucoma Study. To compare the participating sites for variations among subjects and the performance of imaging instruments.
Design
Multicenter longitudinal observational cohort study.
Methods
A total of 788 participants (1329 eyes) were enrolled from 3 academic referral centers. There were 145 participants (289 eyes) in the normal group, 394 participants (663 eyes) in the glaucoma suspect/preperimetric glaucoma group, and 249 participants (377 eyes) in the perimetric glaucoma group. Participants underwent a full clinical examination, standard automated perimetry, and imaging with time-domain and Fourier-domain optical coherence tomography (OCT), scanning laser polarimetry, and confocal scanning laser ophthalmoscopy. The baseline average, population standard deviation, and repeatability of imaging-derived anatomic variables were reported for each technology and center.
Results
Compared to the normal participants, glaucoma suspect/preperimetric glaucoma and perimetric glaucoma groups had significantly reduced anatomic measurements. Repeatability of nerve fiber layer thickness was best for Fourier-domain OCT (overall coefficient of variation <2%), followed by time-domain OCT (coefficient of variation 2%-2.9%), scanning laser polarimetry (coefficient of variation 2.6%-4.5%), and confocal scanning laser ophthalmoscopy rim area (coefficient of variation 4.2%-7.6%). A mixed-effects model showed that the differences between sites was less than 25 percent of the variation within groups and less than the differences between the normal and glaucoma suspect/preperimetric glaucoma group.
Conclusions
Site-to-site variation was smaller than both the variation within groups and the changes attributable to glaucoma. Therefore pooling of participants between sites is appropriate.
Glaucoma is the leading cause of irreversible blindness in the world. It has been estimated that by 2020, almost 80 million people worldwide will be afflicted with open-angle glaucoma or angle closure glaucoma. The diagnosis of glaucoma generally requires clinically documented changes to the optic nerve head and is often characterized by corresponding visual field defects on standard automated perimetry. However, the clinical evaluation of the optic nerve head is subjective and there is significant variability between clinicians. Moreover, clinically detectable nerve fiber layer loss can occur before reproducible defects can be seen on standard automated perimetry. After being diagnosed with glaucoma, the management of patients also depends on detecting changes in the optic nerve head appearance or in the visual field, which are limited by the subjective nature of optic nerve head examination and the low reliability of visual field testing. Finally, there is an even larger population of “glaucoma suspects” and patients with “preperimetric glaucoma” that is composed of patients with ocular hypertension, cup-to-disc asymmetry or enlarged cups, or thinning of the neuroretinal rim, but without firm evidence of glaucomatous damage to the optic nerve on standard automated perimetry. Using standard automated perimetry and optic nerve examination, it can be difficult to differentiate these from early glaucoma damage, and also to determine the point at which a patient “converts” from being a glaucoma suspect to an early glaucoma patient.
Several different technologies have become available to image the optic nerve head, peripapillary retinal nerve fiber layer, and macular ganglion cell complex. These include confocal scanning laser ophthalmoscopy, scanning laser polarimetry, and optical coherence tomography (OCT). The use of these imaging technologies in glaucoma has recently been reviewed. A few studies have compared the performance of all these technologies on the same set of participants, and have generally shown their performance to be similar. However, most of these studies have been cross-sectional, not longitudinal, and did not include glaucoma suspects. Thus it remains unclear which imaging technology and parameters are most predictive of conversion from glaucoma suspect to perimetric glaucoma.
The goal of the Advanced Imaging for Glaucoma (AIG) Study was to develop and assess advanced imaging technologies to improve the diagnosis and management of patients with glaucoma. A similar study, the Diagnostic Innovations in Glaucoma Study (DIGS), also longitudinally evaluated several advanced imaging technologies on patients at risk for glaucoma or with glaucoma who were recruited from a single study site. However, the AIG Study is the first multicenter, prospective, longitudinal study designed to evaluate the 4 most commonly used technologies—that is, time-domain OCT, Fourier-domain OCT, scanning laser polarimetry, and confocal scanning laser ophthalmoscopy—on eyes categorized as normal, glaucoma suspect/preperimetric glaucoma, and perimetric glaucoma. This article describes the design of the AIG Study and the baseline characteristics of the participants who have completed the enrollment process. The baseline results of the primary anatomic variables measured by the advanced imaging modalities are described in their basic forms and the validity of pooling data from multiple sites is investigated.
Methods
The AIG Study is a multicenter, longitudinal, observational cohort study. Participants were recruited at the AIG clinical centers at the University of Pittsburgh, the University of Miami, and the University of Southern California. The study protocols for the clinical centers were approved by the Institutional Review Boards at the University of Pittsburgh, the University of Miami, and the University of Southern California, respectively. The chair and coordinating center protocol was approved by the Institutional Review Board at Oregon Health & Science University. Signed informed consent as outlined in the study protocol was obtained for all participants. The study was conducted in accordance with the ethical standards as stated in the Declaration of Helsinki and the Health Insurance Portability and Accountability Act of 1996. A detailed description of our methods is provided in the AIG Study Manual of Procedures posted on the study website www.AIGStudy.net . The AIG Study is registered with www.clinicaltrials.gov (NCT01314326).
Visits and Procedures
Participants enrolled in the study had an initial qualifying visit that included obtaining a medical and ophthalmic history, eye examination (refraction, visual acuity, external and slit-lamp examination, dilated fundus examination, Goldmann applanation tonometry, pachymetry, gonioscopy), and visual field testing. During this visit, participants indicated their race by selecting from among the following choices: American Indian/Alaska Native, Asian, Native Hawaiian or Pacific Islander, Black or African American, and White. Ethnicity was indicated by selecting between Hispanic/Latino and non-Hispanic/Latino. Qualified participants then had a baseline visit during which the advanced imaging technology scans, axial eye length measurement, and stereo optic disc photography were performed. Subsequent follow-up visits were scheduled every 6 months for perimetric glaucoma and glaucoma suspect/preperimetric glaucoma groups, and every 12 months for the normal group. At all follow-up visits, interval history, eye examination, and advanced imaging scans were obtained. In the perimetric glaucoma and glaucoma suspect/preperimetric glaucoma groups, visual fields were tested every 6 months, and dilated disc photographs were taken every 12 months. In the normal group, visual field testing was performed and disc photographs were taken at the final or year 4 follow-up visit, whichever was earlier.
The visual field was assessed by standard automated perimetry on the Humphrey Field Analyzer (HFA II; Carl Zeiss Meditec, Inc, Dublin, California, USA) using the Swedish Interactive Thresholding Algorithm 24-2. The minimum requirement for reliability included less than 15% fixation losses, less than 33% false positives, and less than 33% false negatives.
Eligibility
Participants in the normal group were required to have both eyes meet the following criteria: normal visual field, intraocular pressure (IOP) less than 21 mm Hg, central corneal thickness greater than 500 μm, open anterior chamber angle, normal-appearing optic nerve head and nerve fiber layer, and no history of glaucoma, retinal pathology, keratorefractive surgery, or chronic ocular or systemic steroid use. Normal visual fields had a normal mean deviation (MD; P > .05), pattern standard deviation (PSD; P > .05), and glaucoma hemifield test (GHT; “within normal limits”). Eyes categorized into the perimetric glaucoma group had glaucomatous visual field loss, defined as either abnormal PSD ( P < .05) or GHT (“outside normal limits”) in a consistent pattern on both qualifying visual field examinations. They also had an optic nerve head or nerve fiber layer defect visible on slit-lamp biomicroscopy appearing as a diffuse or localized thinning of the rim, a splinter hemorrhage, a notch in the rim, or a vertical cup-to-disc ratio more than 0.2 greater than the fellow eye. Borderline visual fields met neither normal nor perimetric glaucoma criteria. The eyes categorized as glaucoma suspect had normal or borderline visual fields and either had ocular hypertension (IOP ≥ 22 mm Hg) or the fellow eye met the eligibility criteria for the perimetric glaucoma group. Preperimetric glaucoma was defined as having a normal or borderline visual field, but with an optic nerve head or nerve fiber layer defect as described for the perimetric glaucoma group.
Exclusion criteria for the entire study consisted of best-corrected visual acuity worse than 20/40, age <40 or >79 years at entry, refractive error ≥+3 or <−7 diopters (D), previous intraocular surgery except for uncomplicated cataract extraction with posterior chamber intraocular lens insertion, diabetic retinopathy, other diseases that may cause visual field loss or optic nerve head abnormalities, inability to view or photograph the optic discs owing to media opacity or poor dilation, inability to obtain advanced imaging data with acceptable quality, inability to perform reliably on automated visual field testing, life-threatening illness, and refusal of informed consent or commitment to the full length of the study.
Endpoints
The endpoint for the normal and glaucoma suspect/preperimetric glaucoma group was the development of visual field abnormality meeting the perimetric glaucoma criteria stated above and confirmed on 3 consecutive tests. The endpoint for the perimetric glaucoma group was confirmed visual field progression on the Glaucoma Progression Analysis software installed on the Humphrey Field Analyzer II. Progression was defined as a significant change detected in at least 3 points, repeated in the same location in 3 consecutive follow-up tests, and categorized by the Glaucoma Progression Analysis software as “likely progression.”
Imaging Protocols
Four advanced imaging technologies were used. For time-domain OCT (Stratus OCT; Carl Zeiss Meditec, Inc, Dublin, California, USA), the Fast Macular Thickness Map scan setting was used to scan the macula, and the Fast RNFL Thickness scan setting was used to measure the peripapillary nerve fiber layer. If the Signal Strength parameter was below 8, another scan was performed. The minimum acceptable Signal Strength parameter was 6. Images were processed with Stratus software version 4.0.
For the Fourier-domain OCT (RTVue; Optovue, Inc, Fremont, California, USA), the ganglion cell complex scan setting was used to scan the macula, while the optic nerve head and 3-D Disc scans were used to map the optic nerve head and nerve fiber layer. Only scans with a signal strength index parameter of ≥30 were saved. Optic nerve head scans with signal strength index >37 and ganglion cell complex scans with signal strength index >42 were analyzed. Images were processed with RTVue software version 6.12.0.24. Fourier-domain OCT technology was introduced in 2007 to the AIG Study. Therefore it was not available at the baseline visit for some participants. In these instances, the first Fourier-domain OCT measurements were used as baseline values.
The scanning laser polarimetry device (GDx-VCC; Laser Diagnostic Technologies, San Diego, California, USA, later acquired by Carl Zeiss Meditec) was first calibrated for corneal birefringence at baseline, and then used to perform 3 sets of nerve fiber layer imaging at each visit. The enhanced corneal compensation (ECC) software version 6.0.0 was used. The scans were required to have a scan quality score (Q) of 8-10.
The confocal scanning laser ophthalmoscopy images were acquired with the Heidelberg Retina Tomograph II (HRT II; Heidelberg Engineering, Heidelberg, Germany). Two optic nerve head scans were performed at each visit. The images were assessed for quality, such as the presence of eye movement, and then the optic disc margin was defined manually. All measurements were processed with HRT II software version 1.7.
Sample Size and Statistical Power
Based on previous work, we assumed that the area under the receiver operator curve for each advanced imaging technology would be in the range of 0.8-0.9. The statistical power calculation then yielded a target of 175 participants in the perimetric glaucoma group and 170 age-matched normal participants to be able to determine the area under the receiver operator curve within ±0.06 with at least 95% confidence. For the longitudinal study of visual field conversion in glaucoma suspect/preperimetric glaucoma group participants, we assumed an overall conversion rate of 4.4% over 5 years based on the Ocular Hypertension Treatment Study. Assuming that 15% of the glaucoma suspect/preperimetric glaucoma group eyes will have abnormal advanced imaging at baseline, the power calculation resulted in a target of 320 participants to detect a difference with 92% power (1-sided t test with P < .05). These calculations assumed the 2 eyes of each participant were perfectly correlated and that the actual statistical power would be higher because only partial correlation exists between the 2 eyes.
The repeatability of advanced imaging–derived anatomic variables was assessed by coefficient of variation and intraclass correlation coefficient. Generalized estimating equations were used to correct for the correlation between eyes within the same participant. The level of statistical significance was set at P < .05. The statistical analyses were performed using SAS 9.2 software (SAS Institute, Cary, North Carolina, USA).
Results
Baseline Participant Characteristics
A total of 788 participants were enrolled. There were 145 participants (289 eyes) in the normal group, 394 participants (663 eyes) in the glaucoma suspect/preperimetric glaucoma group, and 249 participants (377 eyes) in the perimetric glaucoma group ( Table 1 ). The participants in the normal group were significantly younger ( P < .001), less likely to have a family history of glaucoma ( P < .001), and less likely to have systemic hypertension ( P = .011). A great majority of the participants were white, followed by the Black/African American category. The other racial categories constituted 5.5%-10.4% of the groups. The 3 clinical centers contributed evenly to enrollment, but had significant inter-site variation in age, sex, and racial composition ( Table 1 ). Specifically the University of Pittsburgh site had younger normal subjects and more glaucoma suspect/preperimetric glaucoma and perimetric glaucoma participants of African ancestry, while the University of Southern California site had a lower percentage of female patients in the glaucoma suspect/preperimetric glaucoma group. There were no significant differences in sex, race, or history of diabetes mellitus between any of the groups.
| UP | UM | USC | Overall | |
|---|---|---|---|---|
| Number of participants | ||||
| Normal | 56 | 49 | 40 | 145 |
| GSPPG | 158 | 104 | 132 | 394 |
| PG | 74 | 75 | 100 | 249 |
| Total | 288 | 228 | 272 | 788 |
| Number of eyes | ||||
| Normal | 111 | 98 | 80 | 289 |
| GSPPG | 278 | 171 | 214 | 663 |
| PG | 110 | 117 | 150 | 377 |
| Total | 499 | 386 | 444 | 1329 |
| Age ± SD (y) | ||||
| Normal | 53.1 ± 9.0 | 59.2 ± 10.2 | 56.8 ± 8.7 | 56.2 ± 9.7 |
| GSPPG | 60.1 ± 9.8 | 63.9 ± 9.3 | 58.4 ± 8.8 | 60.5 ± 9.5 |
| PG | 62.5 ± 9.6 | 64.8 ± 8.8 | 59.6 ± 9.2 | 62.0 ± 9.4 |
| Sex: female (%) | ||||
| Normal | 75 | 55 | 63 | 64.8 |
| GSPPG | 66 | 63 | 52 | 60.7 |
| PG | 66 | 64 | 51 | 59.4 |
| Race: African American (%) | ||||
| Normal | 9 | 4 | 8 | 6.9 |
| GSPPG | 17 | 10 | 8 | 11.9 |
| PG | 14 | 8 | 10 | 10.4 |
There were many significant differences between normal and glaucomatous eyes ( Table 2 ) that generally followed disease severity; for example, perimetric glaucoma eyes were more severely affected than glaucoma suspect/preperimetric glaucoma eyes. Glaucomatous eyes generally had longer axial length, thinner central corneal thickness, worse visual field, and greater cup-to-disc ratio. The baseline IOP of the glaucoma suspect/preperimetric glaucoma group was significantly higher than the other 2 groups owing to the inclusion of participants with ocular hypertension.
| Normal | GSPPG | P a (Normal vs GSPPG) | PG | P a (Normal vs PG) | |
|---|---|---|---|---|---|
| Axial length (mm) | 23.8 ± 1.0 | 24.2 ± 1.3 | <.0001 | 24.3 ± 1.3 | <.0001 |
| MR sphere (D) | −0.71 ± 1.98 | −1.21 ± 2.34 | .026 | −0.96 ± 2.47 | .069 |
| MR cylinder (D) | 0.54 ± 0.72 | 0.61 ± 0.79 | .25 | 0.65 ± 0.74 | .16 |
| CCT (μm) | 562 ± 32 | 557 ± 39 | .0103 | 545 ± 37 | .0002 |
| IOP (mm Hg) | 14.8 ± 2.8 | 16.4 ± 4.0 | <.0001 | 14.9 ± 4.1 | .016 |
| VF MD (dB) | 0.01 ± 0.93 | −0.61 ± 1.47 | <.0001 | −5.01 ± 4.52 | <.0001 |
| VF PSD (dB) | 1.44 ± 0.20 | 1.68 ± 0.42 | <.0001 | 5.76 ± 4.02 | <.0001 |
| Visual field index | 99.5 ± 0.6 | 98.8 ± 1.8 | <.0001 | 87.9 ± 13.6 | <.0001 |
| Vertical CDR | 0.34 ± 0.19 | 0.52 ± 0.24 | <.0001 | 0.70 ± 0.23 | <.0001 |
| Horizontal CDR | 0.33 ± 0.18 | 0.49 ± 0.23 | <.0001 | 0.65 ± 0.22 | <.0001 |
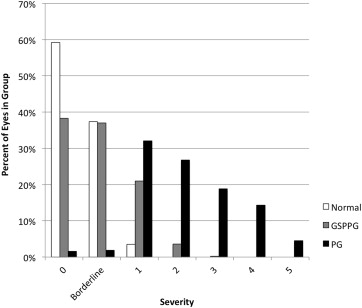
The distribution of disease severity ( Figure 1 ) was assessed by the enhanced Glaucoma Staging System 2, a glaucoma staging system based on visual field MD and PSD. Almost all eyes in the normal group and most of the eyes in the glaucoma suspect/preperimetric glaucoma group were classified as either stage 0 or borderline stage. There were 10 eyes (3.5%) in the normal group that were classified as stage 1 owing to abnormal visual field MD. Abnormal visual field MD was not part of the AIG Study visual field criteria because MD can be affected by cataract and other common causes of visual loss not specific to glaucoma. Twelve eyes (3.2%) in the perimetric glaucoma group were classified as stage 0 or borderline. These eyes had normal visual field MD values but had consistent focal visual field damage detected by GHT, which was part of the AIG Study visual field criteria. Most of the perimetric glaucoma group had mild to moderate visual field loss, with less than 20% in the late stages (stages 4 and 5).
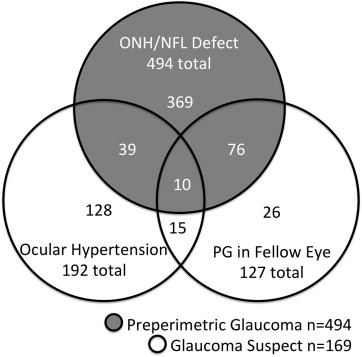
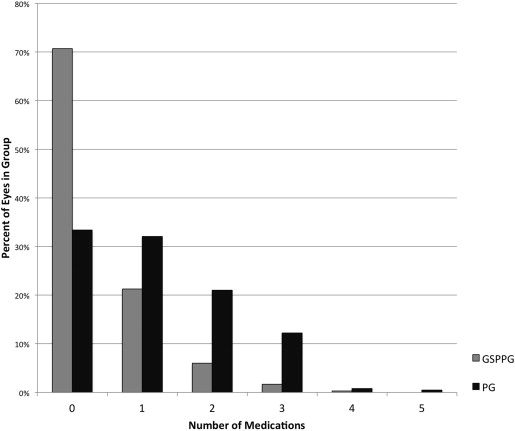
In the glaucoma suspect/preperimetric glaucoma group, the majority of eyes (494 of 663 eyes, 74.5%) belonged in the preperimetric glaucoma subgroup ( Figure 2 ). In the glaucoma suspect subgroup (169 of 663 eyes, 25.5%), most were enrolled owing to ocular hypertension, while others were enrolled for the presence of perimetric glaucoma in the other eye of the same individual. At the baseline visit, most perimetric glaucoma participants were using topical glaucoma medications ( Figure 3 ). The number of topical medications used among perimetric glaucoma eyes (1.2 ± 1.1; mean ± standard deviation) was more than those among the glaucoma suspect/preperimetric glaucoma eyes (0.4 ± 0.7).
Baseline Advanced Imaging Measurements
The primary diagnostic anatomic variables (nerve fiber layer, ganglion cell complex, and disc) from the 4 advanced imaging modalities all had significantly lower values in both glaucoma suspect/preperimetric glaucoma and perimetric glaucoma groups compared to the normals, even after the conservative Bonferroni correction ( Table 3 ). As expected, the values were smaller in perimetric glaucoma eyes compared to the glaucoma suspect/preperimetric glaucoma eyes.
| Variable | Normal | GSPPG | P a (Normal vs GSPPG) | PG | P a (Normal vs PG) |
|---|---|---|---|---|---|
| TD-OCT | |||||
| Overall NFL (μm) | 99.2 ± 9.9 | 92.8 ± 13.2 | <.0001 | 77.1 ± 15.5 | <.0001 |
| Superior NFL (μm) | 120.2 ± 15.2 | 112.1 ± 20.5 | <.0001 | 92.4 ± 23.3 | <.0001 |
| Inferior NFL (μm) | 128.4 ± 15.8 | 117.8 ± 19.7 | <.0001 | 91.6 ± 25.4 | <.0001 |
| Nasal NFL (μm) | 79.1 ± 17.2 | 72.6 ± 17.1 | <.0001 | 64.3 ± 16.3 | <.0001 |
| Temp. RNFL (μm) | 69.7 ± 13.7 | 68.3 ± 14.8 | .13 | 60.0 ± 16.7 | <.0001 |
| FD-OCT | |||||
| Overall NFL (μm) | 99.6 ± 8.0 | 93.5 ± 10.1 | <.0001 | 81.3 ± 12.2 | <.0001 |
| Superior NFL (μm) | 121.0 ± 11.0 | 113.8 ± 14.7 | <.0001 | 97.6 ± 18.7 | <.0001 |
| Inferior NFL (μm) | 123.6 ± 12.1 | 114.6 ± 15.0 | <.0001 | 94.2 ± 19.2 | <.0001 |
| Nasal NFL (μm) | 79.6 ± 10.8 | 74.2 ± 10.4 | <.0001 | 67.8 ± 11.7 | <.0001 |
| Temp. NFL (μm) | 74.3 ± 7.9 | 71.7 ± 9.7 | .0011 | 65.7 ± 11.3 | <.0001 |
| Overall GCC (μm) | 97.3 ± 6.9 | 92.9 ± 8.1 | <.0001 | 83.5 ± 10.8 | <.0001 |
| Superior GCC (μm) | 96.8 ± 6.9 | 92.8 ± 8.3 | <.0001 | 85.7 ± 11.4 | <.0001 |
| Inferior GCC (μm) | 97.8 ± 7.2 | 93.1 ± 8.6 | <.0001 | 81.4 ± 12.9 | <.0001 |
| cSLO | |||||
| Overall NFL (mm) | 0.26 ± 0.07 | 0.24 ± 0.07 | <.0001 | 0.19 ± 0.08 | <.0001 |
| Rim area (mm 2 ) | 1.41 ± 0.40 | 1.32 ± 0.34 | .0009 | 1.08 ± 0.34 | <.0001 |
| SLP | |||||
| Overall NFL (μm) | 53.9 ± 4.8 | 52.4 ± 7.5 | .0008 | 45.5 ± 7.6 | <.0001 |
| Superior NFL (μm) | 66.6 ± 7.4 | 63.9 ± 8.8 | <.0001 | 55.7 ± 11.3 | <.0001 |
| Inferior NFL (μm) | 67.01 ± 7.2 | 64.9 ± 8.6 | <.0001 | 55.3 ± 12.9 | <.0001 |
The imaging parameters were then analyzed by study site ( Table 4 ). In the normal group, the nerve fiber layer thicknesses as measured by both the time-domain OCT and Fourier-domain OCT variables were statistically equivalent at the 3 sites. However, the variables for the other 2 devices were significantly different, and in an inconsistent pattern. The University of Southern California site had significantly greater confocal scanning laser ophthalmoscopy rim area, while the University of Miami site had significantly lower scanning laser polarimetry nerve fiber layer thickness (this overall value is called TSNIT average on the scanning laser polarimetry printout). In the glaucoma suspect/preperimetric glaucoma group, there was again a significantly greater confocal scanning laser ophthalmoscopy rim area for subjects at the University of Southern California site and a trend for lower scanning laser polarimetry nerve fiber layer thickness at the University of Miami site, while the OCT nerve fiber thickness variables were statistically equivalent at all sites. In the perimetric glaucoma group, there were significant differences between the sites for all advanced imaging technologies in a consistent pattern; that is, perimetric glaucoma patients from the University of Pittsburgh site had milder glaucoma than those from the other 2 sites.
| UP | UM | USC | P a | |
|---|---|---|---|---|
| Normal group | ||||
| TD-OCT NFL (μm) | 99.9 ± 10.1 | 97.9 ± 9.1 | 99.8 ± 10.6 | .53 |
| FD-OCT NFL (μm) | 98.6 ± 8.3 | 99.2 ± 8.5 | 101.8 ± 6.3 | .18 |
| FD-OCT GCC (μm) | 97.9 ± 7.4 | 95.8 ± 6.8 | 98.3 ± 6.1 | .19 |
| cSLO NFL (μm) | 0.27 ± 0.06 | 0.25 ± 0.07 | 0.27 ± 0.07 | .06 |
| cSLO rim area (mm 2 ) | 1.34 ± 0.29 | 1.32 ± 0.42 | 1.60 ± 0.44 | .0003 |
| SLP NFL (μm) | 55.2 ± 4.8 | 51.7 ± 4.2 | 54.6 ± 4.5 | .0002 |
| GSPPG group | ||||
| TD-OCT NFL (μm) | 94.1 ± 13.5 | 91.1 ± 12.4 | 92.5 ± 13.4 | .25 |
| FD-OCT NFL (μm) | 94.3 ± 9.6 | 93.3 ± 9.6 | 92.8 ± 11.2 | .77 |
| FD-OCT GCC (μm) | 93.7 ± 8.5 | 91.4 ± 7.2 | 93.3 ± 8.2 | .044 |
| cSLO NFL (μm) | 0.24 ± 0.07 | 0.24 ± 0.07 | 0.22 ± 0.08 | .063 |
| cSLO rim area (mm 2 ) | 1.33 ± 0.31 | 1.25 ± 0.33 | 1.36 ± 0.37 | .043 |
| SLP NFL (μm) | 53.6 ± 5.4 | 51.1 ± 10.8 | 51.5 ± 5.9 | .038 |
| PG group | ||||
| TD-OCT NFL (μm) | 80.9 ± 14.3 | 73.6 ± 16.4 | 77.1 ± 15.2 | .02 |
| FD-OCT NFL (μm) | 85.3 ± 11.1 | 79.5 ± 13.8 | 79.9 ± 10.6 | .018 |
| FD-OCT GCC (μm) | 87.0 ± 11.4 | 80.8 ± 10.6 | 83.6 ± 9.7 | .003 |
| cSLO NFL (mm) | 0.21 ± 0.09 | 0.18 ± 0.07 | 0.19 ± 0.07 | .078 |
| cSLO rim area (mm 2 ) | 1.17 ± 0.35 | 1.00 ± 0.28 | 1.08 ± 0.36 | .017 |
| SLP NFL (μm) | 49.0 ± 7.1 | 41.9 ± 6.8 | 45.1 ± 7.5 | <.0001 |
Stay updated, free articles. Join our Telegram channel

Full access? Get Clinical Tree


