Purpose
To assess whether adherence to dietary guidelines at baseline is associated with the incidence of visual impairment among older persons after 10 years.
Design
A population-based cohort of 3654 participants of the Blue Mountains Eye Study were examined at baseline and were reexamined after 5 and 10 years.
Methods
The incidence of visual impairment was defined as best-corrected visual acuity (VA) <20/40 at follow-up in 1 or both eyes. Dietary information was obtained at baseline using a validated food frequency questionnaire (FFQ). Total Diet Score (TDS) was calculated based on the Australian diet quality index. TDS includes components of diet quality; poor dietary habits; and energy balance. Discrete logistic regression models with time-dependant outcome variables were used to calculate hazard risk ratios (HR) and 95% confidence intervals (CI) associated with incidence of visual impairment for each unit/quartile increase in TDS, adjusting for potential confounders.
Results
Of the 3654 baseline participants, 1963 had up to 10 years follow-up with completed FFQs. With each unit increase in TDS, the risk of visual impairment decreased (HR 0.94, 95% CI 0.88–1.00). The risk of developing visual impairment was lower among persons in the highest compared to the lowest TDS quartile (HR 0.71, 95% CI 0.47–1.05). This association was significant among persons aged 65+ years (HR 0.63, 95% CI 0.38–0.98) but not those aged <65 years (HR 0.95, 95% CI 0.46–1.97).
Conclusions
Compliance to dietary guidelines was associated with a decreased long-term risk of visual impairment in this sample of Australians aged 65+ years.
Visual impairment affects up to 27% of the population worldwide and is more prevalent among older persons. Visual impairment has previously been found to impact negatively on emotional well-being, physical functioning, and independent living, which are becoming increasing concerns, given the aging population.
Different dietary guidelines and diet quality indices exist worldwide and vary according to different populations and diseases. The 2 most frequently used diet quality assessment tools are the Healthy Eating Index and the Diet Quality Index. An unhealthy diet and lifestyle that includes a high consumption of fat, sugar, salt, alcohol, and smoking can accelerate aging and degenerative processes via increased oxidative stress, which may contribute to the development of cataract and age-related macular degeneration (AMD), the 2 main causes of visual impairment and blindness in older people worldwide. However, to our knowledge, the association between overall diet quality and all-cause visual impairment has not been reported previously.
This study aimed to investigate longitudinal associations between baseline diet quality, indicated by adherence to the Dietary Guidelines for Australian Adults, and the 10-year incidence of visual impairment in the Blue Mountains Eye Study cohort.
Methods
Population
The Blue Mountains Eye Study is a population-based study of vision and common eye diseases in a suburban Australian population aged 49+ years, residing in the Blue Mountains area west of Sydney. Detailed methods of the baseline survey were reported previously. In summary, at baseline (1992–1994) we recruited and examined 3654 participants. Surviving baseline participants were invited to participate in 5- and 10-year follow-up examinations. Of these, 2334 returned after 5 years (75.8% of survivors) and 1952 after 10 years (76.5% of survivors).
All baseline and follow-up visits of the Blue Mountains Eye Study were approved by the Human Research Ethics Committees of the University of Sydney and the Western Sydney Area Health Service, and were conducted adhering to the tenets of the Declaration of Helsinki. Signed informed consent was obtained from all participants at each examination visit.
Measures
Vision assessment
Best-corrected visual acuity (VA) was measured after subjective refraction, using a logarithm of the minimal angle of resolution chart (logMAR) and modified Early Treatment Diabetic Retinopathy Study (ETDRS) methods at each examination. Visual impairment was defined as VA in the better eye <20/40 (39 letters or less read), and blindness (severe visual impairment) as VA <20/200 (4 letters or less read). An eye was considered at risk of developing visual impairment if VA was 20/40 or better at baseline, or at risk of developing blindness if VA was 20/200 or better at baseline. The incidence of visual impairment was defined as the development of visual impairment in 1 or both eyes of the person who had at least 1 eye at risk of developing visual impairment at baseline. The severity of visual impairment was defined according to VA in the better eye at the latest follow-up visit.
Dietary assessment
Diet was assessed with a semi-quantitative food frequency questionnaire, which included 145 items adapted for the Australian diet from a Willett food frequency questionnaire. Participants used a frequency scale ranging from never to 4 times a day to indicate typical consumption of particular food items throughout the past year. Participants were excluded if their food frequency questionnaires had more than 12 food frequency questionnaire items missing, or had energy intakes <2500 kJ or >18 000 kJ. Finally, nutrient data were screened for extreme values, inspecting values in the upper and lower 2% of the distribution to locate and correct any data entry errors and to check for plausibility, by an accredited practicing dietician (V.F.). Validity of the food frequency questionnaire was assessed in a subsample (n = 78) at baseline comparing nutrient intakes from the food frequency questionnaire to the weighed food records over 12 days, and energy-adjusted Spearman correlations above 0.5 were found for most nutrients. Australian Tables of Food Composition were used to estimate dietary nutrient intakes, using the electronic database NUTTAB90 for the food frequency questionnaires collected at baseline and a purpose-built software analysis system to generate average daily nutrient intake.
The Total Diet Score (TDS) was developed based on a modified version of the Australian diet quality index to assess adherence to the Dietary Guidelines for Australian Adults and the Australian Guide to Healthy Eating. Development details of the Total Diet Score have been published previously. Briefly, the Total Diet Score is divided into 10 components with a possible score of 0–2 per component. For example, a person who consumed fruit and vegetables more frequently, including a moderate variety of vegetables, scored a maximum score of 2 for this component. The dietary components of the Total Diet Score considered intakes from the core food groups (vegetables, legumes, and fruit; cereals; meat and meat alternatives; milk, yogurt, and cheese) and optimal food choices as recommended by the Australian Guide to Healthy Eating (whole grain cereals, lean red meat, low-fat or reduced-fat milk, low saturated fat intake, and fish consumption, as well as lower intakes of sodium, alcohol, sugar, and extra foods that do not provide essential nutrients the body needs, eg, energy-dense nutrient-poor foods [foods with high levels of fat, salt, and sugar]). The recommended servings for each food group were taken from the Australian Guide to Healthy Eating with some exceptions; for example, 2 servings of fruit per day were replaced with 3 servings per day and 5 servings of vegetables per day replaced with 7 servings per day to adjust for self-reported overestimation, as suggested by a previous study.
The nondietary Australian Guide to Healthy Eating recommendation for preventing weight gain was also included as 1 of the 10 Total Diet Score components. Half of this component was assigned to energy balance (the ratio of energy intake to energy expenditure) and the remaining half to leisure-time physical activity. Physical activity levels were self-reported using questions from the Australian National Heart Foundation Risk Factor Prevalence Surveys (Risk Factor Prevalence Study Management Committee, 1989). Walking and moderate or vigorous activities were scored as Metabolic Equivalents, as described by Craig and associates, and divided into tertiles.
The sum of scores from the 10 components was calculated for each person, with a maximum score of 20. Higher scores indicated greater adherence to the dietary guidelines.
Statistical Analysis
SAS 9.2 software (SAS Institute, Cary, North Carolina, USA) was used for statistical analyses. PROC LIFETEST was used to estimate the incidence rate of visual impairment. Both continuous score data (per-unit increase) and quartiles of Total Diet Score were used as independent variables and incidence of visual impairment or blindness as dependent variables in analyses. Discrete logistic regression models (PROC PHREG) with a time-dependant outcome variable (visual impairment) were used to estimate associations of incident visual impairment or blindness with baseline Total Diet Score scores or Total Diet Score quartiles where quartile 1 (the group with the least adherence) of the Total Diet Score was the reference level. This model discrete logistic regression allows the use of time information when visual impairment was detected among participants who had attended 1 or both follow-up examinations (5-year, 10-year follow-up visits).
The detrimental effect of smoking on visually impairing eye diseases such as AMD has been previously well documented. Persons who smoked were excluded in a supplementary analysis to eliminate the effect of this potential confounder on the association under investigation.
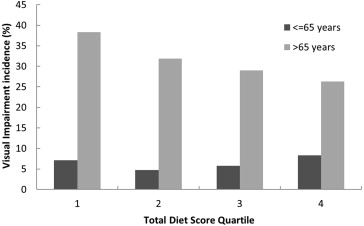
Visual impairment has previously been found to be more frequent among persons older than 65 years compared to persons 65 years or younger in this cohort ; hence we performed analyses stratified by age group to assess the association between TDS and visual impairment in the 2 age groups separately ( Figure ). Analyses were adjusted for age, sex, history of diabetes or cardiovascular disease, smoking status, education, and home ownership. The associations are presented as hazard risk ratios (HR) with 95% confidence intervals (CI).
Results
Of the 3654 baseline participants, the food frequency questionnaire was attempted and returned by 3267 participants (89.4% response); of these, 2897 were suitable for analysis (79.3% of participants). Among these participants, 1963 (67.8%) had been followed at the 10-year follow-up examination and thus were included in this report.
The baseline characteristics of participants who attended the 10-year follow-up examination compared to those who did not present to follow-up examinations are presented in Table 1 . Participants who attended the 10-year follow-up examination were more likely to be female, and to have a younger age and a higher Total Diet Score, compared to participants who did not attend any follow-up visits.
| Participants | Nonparticipants | P Value | |
|---|---|---|---|
| Total numbers | 1963 | 934 | |
| Mean Total Diet Score (range) | 9.4 (9.3–9.5) | 9.0 (8.9–9.1) | <.001 |
| Mean age in years (SD) | 63.4 (63.1–63.8) | 69.4 (68.7–70.1) | <.001 |
| Female (%) | 57.1 | 53.5 | .07 |
| Current smoker (%) | 12.6 | 17.3 | <.001 |
| Tertiary education (%) | 61.8 | 54.9 | <.001 |
| Married or de facto (%) | 69.2 | 60.2 | <.001 |
| Mean body mass index (SD) | 26.4 (26.2–26.6) | 25.7 (25.4–26.0) | <.001 |
Baseline characteristics by quartile of Total Diet Score are presented in Table 2 . Baseline Total Diet Score ranged from a minimum score of 3.17 to a maximum of 15.40, out of a possible total score of 20. Women, nonsmoking participants, and those reporting tertiary education had a higher mean Total Diet Score.
| Quartile 1 | Quartile 2 | Quartile 3 | Quartile 4 | |
|---|---|---|---|---|
| Total number | 488 | 493 | 495 | 487 |
| Mean Total Diet Score (range) | 6.6 (3.2–7.8) | 8.6 (7.8–9.3) | 10.1 (9.3–11.0) | 12.2 (11.0–15.4) |
| Mean age, years (SD) | 62.5 (8.1) | 63.8 (8.2) | 62.9 (8.1) | 64.6 (7.7) |
| Female (%) | 41.4 | 57.4 | 59.8 | 69.8 |
| Any visual impairment (%) | 12.4 | 11.2 | 9.0 | 9.2 |
| Smoking status (%) | ||||
| Current | 21.3 | 13.2 | 10.3 | 5.7 |
| Past | 41.78 | 38.1 | 33.6 | 32.6 |
| Never | 36.9 | 48.7 | 56.1 | 61.8 |
| Tertiary education (%) | 59.2 | 61.7 | 62.6 | 63.8 |
| Marital status (%) | ||||
| Married or de facto | 67.2 | 70.0 | 72.9 | 66.9 |
| Divorced or separated | 13.8 | 10.1 | 11.7 | 11.9 |
| Widowed | 10.5 | 13.0 | 9.1 | 13.8 |
| Never married | 8.6 | 6.9 | 6.3 | 7.4 |
| Mean body mass index (SD) | 26.4 (4.4) | 26.7 (5.6) | 26.6 (4.3) | 25.9 (4.2) |
Cross-sectional analysis of baseline data showed that each unit increase in baseline Total Diet Score was nonsignificantly associated with a lower prevalence of visual impairment (adjusted HR 0.96, 95% CI 0.90–1.02). Persons in the highest Total Diet Score quartile had a nonsignificant lower prevalence of visual impairment compared to those in the lowest Total Diet Score quartile (adjusted HR 0.78, 95% CI 0.53–1.15).
Of the 1963 participants reexamined at the 10-year follow-up, we observed a 6% decrease in the 10-year risk of visual impairment associated with per-unit increase in baseline Total Diet Score (HR 0.94, 95% CI: 0.88–1.00). Participants in the highest Total Diet Score quartile at baseline had a 29% decreased risk of developing visual impairment compared to those in the lowest quartile, although this difference was not statistically significant (adjusted HR 0.71, 95% CI 0.47–1.05) ( Table 3 ). When participants who were current smokers were removed from the analysis, the association remained the same (adjusted HR 0.71, 95% CI 0.44–1.05).
| N | Hazard Ratio a | 95% CI | P Value | |
|---|---|---|---|---|
| All | ||||
| Quartile 1 | 88 | 1.0 | – | – |
| Quartile 2 | 82 | 0.73 | 0.49–1.08 | .11 |
| Quartile 3 | 78 | 0.69 | 0.46–1.03 | .07 |
| Quartile 4 | 86 | 0.71 | 0.47–1.05 | .09 |
| Per-unit increase in TDS | 0.94 | 0.88–1.00 | .05 | |
| ≤65 years | ||||
| Quartile 1 | 33 | 1.0 | – | – |
| Quartile 2 | 24 | 0.60 | 0.27–1.35 | .21 |
| Quartile 3 | 26 | 0.79 | 0.38–1.66 | .53 |
| Quartile 4 | 32 | 0.95 | 0.46–1.97 | .89 |
| Per-unit increase in TDS | 0.98 | 0.86–1.12 | .79 | |
| >65 years | ||||
| Quartile 1 | 55 | 1.0 | – | – |
| Quartile 2 | 58 | 0.75 | 0.47–1.19 | .22 |
| Quartile 3 | 52 | 0.65 | 0.4–1.06 | .08 |
| Quartile 4 | 54 | 0.61 | 0.38–0.98 | .04 |
| Per-unit increase in TDS | 0.92 | 0.85–0.99 | .03 |
Stay updated, free articles. Join our Telegram channel

Full access? Get Clinical Tree


